
Facts and stats about Australia
Author: jaacosta47
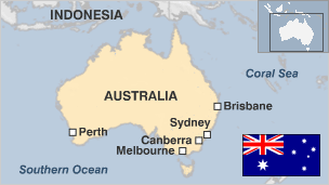
The Australian continent is considered the world’s largest island in terms of land area. It is the only nation to govern a whole continent. The country has a stable democracy with distinct culture and highly competitive economy. Australia is one of the most ideal countries to live in based on economic performance, national income, civil rights, healthcare services and human development. Ironically, the population is small compared to its huge territory. This nation has a budding orientation with respect to its neighbors in Asia. This is manifested clearly in the current economic policies of its government. Australia is one of the principal members of the Asia Pacific Economic Cooperation. The APEC is engaged in various free trade accords with the Association of Southeast Asian Nations or ASEAN and major power China. Australia has also arbitrated between warring groups in Papua, New Guinea and Solomon Islands.
- Agriculture 212
- Background 10
- Conflict 14
- Cost of living 55
- Crime 108
- Culture 37
- Disasters 37
- Economy 3028
- Education 421
- Energy 1568
- Environment 236
- Geography 92
- Government 204
- Health 367
22.26 million
Population. Ranked 55th in 2013.
$67,035.57
GDP per capita. Ranked 5th in 2012.
7.68 million sq km
Sq. km. Ranked 6th in 2008.