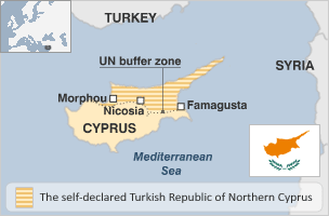
|
Changes in inventories > current LCU
|
60000000 |
...
|
|
|
Changes in inventories > current US$
|
110,640,000 $
|
...
|
[52nd of 138]
|
|
Chemicals > % of value added in manufacturing
|
3.11 %
|
...
|
[57th of 91]
|
|
Machinery and transport equipment > % of value added in manufacturing
|
4.21 %
|
...
|
[45th of 91]
|
|
Manufactures exports > % of merchandise exports
|
62.79 %
|
...
|
[51st of 156]
|
|
Manufactures imports > % of merchandise imports
|
67.58 %
|
...
|
[64th of 155]
|
|
Manufacturing, value added > annual % growth
|
2.98 %
|
...
|
[75th of 156]
|
|
Manufacturing, value added > constant LCU
|
287000000 |
...
|
|
|
Manufacturing, value added > current LCU
|
443500000 |
...
|
|
|
Manufacturing, value added > current US$
|
903,320,800 $
|
...
|
[66th of 167]
|
|
Ores and metals exports > % of merchandise exports
|
2.79 %
|
...
|
[51st of 154]
|
|
Ores and metals imports > % of merchandise imports
|
1.14 %
|
...
|
[80th of 155]
|
|
Other manufacturing > % of value added in manufacturing
|
32.4 %
|
...
|
[51st of 107]
|
|
Patent applications, nonresidents
|
85
|
...
|
[48th of 96]
|
|
Patent applications, residents
|
9
|
...
|
[53rd of 97]
|
|
Textiles and clothing > % of value added in manufacturing
|
21.52 %
|
...
|
[10th of 101]
|
|
value added > annual % growth
|
2.67 %
|
...
|
[98th of 164]
|
|
value added > constant LCU
|
569400000 |
...
|
|
|
value added > current LCU
|
847900000 |
...
|
|
|
value added > current US$
|
1,727,003,000 $
|
...
|
[87th of 172]
|