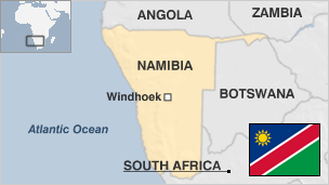
FACTOID # 1: Japan's water has a very high dissolved oxygen concentration - but not enough to prevent drowning in the bath.
 
 Home   Encyclopedia   Statistics   Countries A-Z   Flags   Maps   Education   Forum   FAQ   About 


WHAT'S NEW
 

SEARCH ALL

FACTS & STATISTICS    Advanced view

Search encyclopedia, statistics and forums:


(* = Graphable)


Africa > Namibia > Environment

NAMIBIAN ENVIRONMENT STATS:   Top Stats   All Stats  
View this page with:    Just Stats   Sources   Definitions   Both  
Areas under protection 87 [87th of 146]
Carbon efficiency 141 CO2 emissions/$ GDP [141st of 141]
CFC consumption 76 [76th of 107]
CO2 Emissions 124 [124th of 178]
Current issues
very limited natural fresh water resources; desertification; wildlife poaching; land degradation has led to few conservation areas
Ecological footprint 140 [140th of 141]
Endangered species protection 37% [37th of 141]
Known breeding bird species 79 [79th of 146]
Known mammal species 26 [26th of 145]
Marine fish catch 37 tons [37th of 141]
NOx emissions per populated area 7 thousand metric tons/squ [7th of 141]
Pollution > Carbon dioxide 1999 183 [183rd of 199]
Protected area 29 [29th of 147]
SO2 emissions per populated area 58 thousand metric tons/squ [58th of 141]
Threatened species 73 [73rd of 158]
Threatened species > Mammal 70 [70th of 160]
Water > Availability 139 thousand cubic metres [139th of 141]
Water > Phosphorus concentration 64 mls/litre [64th of 141]
Wetlands of intl importance > Area 26 thousand hectares [26th of 112]
Wildness 13% [13th of 141]

... View all Environment stats

SOURCES: Protected Areas under IUCN management categories I - VI (1992-2003); Carbon economic efficiency (CO2 emissions per dollar GDP)
Units: Metric Tons/US Dollar GDP; CFC consumption
Units: Ozone Depletion Potential (ODP) Tons (Metric Tons x ODP)
Units: The indicator was obtained by multiplying the Total CFCs emissions (metric tons per ozone depletion potential) with the Per capita CFCs emissions (obtained by dividing the total CFCs emissions by the population in 1997). In calculating the ESI, the base-10 logarithm of this variable was used.; CO2: Total Emissions (excluding land-use) Units: thousand metric tonnes of carbon dioxide; This entry lists the most pressing and important environmental problems. The following terms and abbreviations are used throughout the entry: ; Ecological footprint per capita
Units: Hectares per Person; Percent of CITES reporting requirements met
Units: Percent of Requirements Met
Units: Countries that have not ratified the CITES convention are recorded as having zero percent of their requirements met.; Known breeding bird mammal species (1992-2002).; Known mammal species (1992-2002).; Total marine fish catch
Units: Metric Tons; NOx emissions per populated land area
Units: 1000 Metric Tons/Sq. Km. of Populated Land Area
Units: We obtained the total emissions for each country by summarizing emissions data, originally available as a grid map with 1 degree x 1 degree cells. Air pollution is generally greatest in densely populated areas. To take this into account, we used the Gridded Population of the World dataset available from CIESIN and calculated the total land area in each country inhabited with a population density of greater than 5 persons per sq. km. We then used this land area as a denominator for the emissions data.; 1999 total CO2 emissions from fossil-fuel burning, cement production, and gas flaring. Emissions are expressed in thousand metric tons of carbon (not CO2).; Environmentally protected area (1997); SO2 emissions per populated land area
Units: 1000 Metric Tons/Sq. Km. of Populated Land Area
Units: We obtained the total emissions for each country by summarizing emissions data, originally available as a grid map with 1 degree x 1 degree cells. Air pollution is generally greatest in densely populated areas. To take this into account, we used the Gridded Population of the World dataset available from CIESIN and calculated the total land area in each country inhabited with a population density of greater than 5 persons per sq. km. We then used this land area as a denominator for the emissions data.; Number of Threatened Species (1990-99); Number of threatened mammal species (1997); Water availability per capita (1961-1990 (avg.))
Units: Thousands Cubic Meters/Person
Units: This variable measures internal renewable water (average annual surface runoff and groundwater recharge generated from endogenous precipitation); Phosphorus concentration
Units: Milligrams/Liter
Units: The country values represent averages of the station-level values for the three year time period 1994-96, except where data were only available for an earlier time period (1988-1993). The number of stations per country varies depending on country size; number of bodies of water; and level of participation in the GEMS monitoring system. The data from "The Wellbeing of Nations" included a smaller subset of stations representing outfalls of major watersheds. An analysis of a sample of countries with numerous stations found that the data for stations in the subset is broadly comparable to the data for all GEMS stations in those countries.; Wetlands of international importance 2002; Percent of land area having very low anthropogenic impact
Units: Percent of Land Area
Units: Global grids for population (GPW), land use (USGS AVHRR based classification from EROS data center), VMAP roads, VMAP railways, VMAP coastlines, VMAP major rivers and the stable lights data were all scored for "wildness". The scores were aggregated and normalized.

ALTERNATIVE NAMES: Namibia, Republic of Namibia

Related links:

More facts and figures on Namibia


COMMENTARY     

There are 1 more (non-authoritative) comments on this page

Share your thoughts, questions and commentary here
Your name
Your location
Your comments
Please enter the 5-letter protection code


Lesson Plans | Student Area | Student FAQ | Reviews | Press Releases |  Feeds | Contact
© Copyright NationMaster.com 2003-2008. All Rights Reserved. Usage implies agreement with terms.