
Facts and stats about Indonesia
Author: jaacosta47
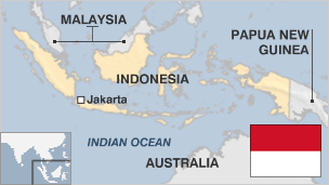
Indonesia is the biggest archipelago in the globe made up of five main islands and 30 other small atolls. It is nestled between the Indian and Pacific Oceans and connects the Australian and Asian Continents. The strategic position has shaped the socio-economic, cultural and political aspects of Indonesia. It used to be a Dutch colony and only attained its independence from the Netherlands in 1949. The Indonesian Government has to cope with vital issues such as human rights violations by the armed forces; implementation of reforms required by the International Monetary Fund (IMF) for the banking industry; bring about a transition from 40 years of authoritarianism to democracy; addressing separatist problems (Aceh and Irian Jaya); and, dealing with accusations of corruption and cronyism. International observers believe that Indonesia is a nation with many problems particularly majority of its citizens subsisting on below $2 every day. Malnutrition and child mortality rates are quite high. A big number of urban residents live in illegal settlements along the canals.
- Agriculture 192
- Background 10
- Conflict 2
- Cost of living 53
- Crime 76
- Culture 30
- Disasters 9
- Economy 3371
- Education 624
- Energy 1234
- Environment 238
- Geography 85
- Government 228
- Health 331
- Import 5
251.16 million
Population. Ranked 4th in 2013.
$3,557.39
GDP per capita. Ranked 106th in 2012.
1.81 million sq km
Sq. km. Ranked 16th in 2008.