
Facts and stats about Belize
Author: Edsel.G
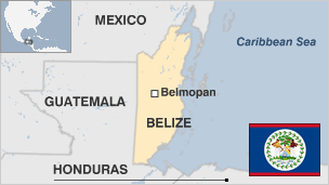
Belize is a small country in Central America. It is bordered by Mexico, Guatemala, and the Caribbean Sea. With a population of just a little more than three hundred thousand, Belize is the least densely populated country in the continent.
The Spaniards were the first Europeans to set foot on the territory, although they did not stay there for long because of the absence of minerals as gold and other precious metals. By the 17th century, the place became a part of the British Empire, and was identified as the British Honduras. They sought independence from Great Britain in 1973, but they chose to retain Queen Elizabeth as their head of state.
The geographic location of the country has blessed it with rich flora and fauna and is, in fact, considered to be a haven for creatures long identified as threatened to extinction.
Belize experiences a 4% annual economic growth. Its market is fueled by petroleum exports, but it is not enough to solidify its economy. Poor tax collection is also adding to the economic problems of the country. Agriculture is also important, and banana plantations are the largest employers in the country.
Tourism has expanded in the country in the last decade. The combination of a rich flora and fauna, the exotic appeal of the Caribbean, and the cool tropical weather all contribute to the influx of tourists to the country.
- Agriculture 107
- Background 8
- Cost of living 49
- Crime 66
- Culture 15
- Economy 2461
- Education 575
- Energy 356
- Environment 169
- Geography 80
- Government 173
- Health 259
- Import 2
- Industry 58
334,297
Population. Ranked 177th in 2013.
$4,576.64
GDP per capita. Ranked 105th in 2011.
22,810 sq km
Sq. km. Ranked 142nd in 2008.