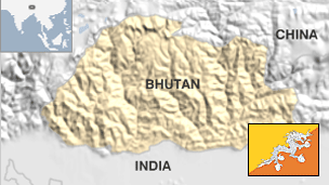
|
SEARCH ALL
|
FACTS & STATISTICS
|
|
Search encyclopedia, statistics and forums:
|
|
|
| BHUTANESE INDUSTRY STATS: |
| Top Stats |
| | All Stats |
|
|
|
| |
|
|
|
Changes in inventories > constant LCU
|
-43000000 |
...
|
|
|
Changes in inventories > current LCU
|
-48000000 |
...
|
|
|
Changes in inventories > current US$
|
-1,057,036 $
|
...
|
[106th of 138]
|
|
Chemicals > % of value added in manufacturing
|
22.86 %
|
...
|
[4th of 91]
|
|
Manufactures exports > % of merchandise exports
|
39.95 %
|
...
|
[81st of 156]
|
|
Manufactures imports > % of merchandise imports
|
69.59 %
|
...
|
[84th of 155]
|
|
Manufacturing, value added > annual % growth
|
5 %
|
...
|
[59th of 156]
|
|
Manufacturing, value added > constant 2000 US$
|
45,151,040 constant 2000 US$
|
...
|
[103rd of 155]
|
|
Manufacturing, value added > constant LCU
|
2029650000 |
...
|
|
|
Manufacturing, value added > current LCU
|
2627192000 |
...
|
|
|
Manufacturing, value added > current US$
|
58,892,440 $
|
...
|
[112nd of 167]
|
|
Ores and metals exports > % of merchandise exports
|
3.11 %
|
...
|
[55th of 154]
|
|
Ores and metals imports > % of merchandise imports
|
0.83 %
|
...
|
[121st of 155]
|
|
Other manufacturing > % of value added in manufacturing
|
52.23 %
|
...
|
[17th of 107]
|
|
Textiles and clothing > % of value added in manufacturing
|
5.27 %
|
...
|
[66th of 101]
|
|
value added > annual % growth
|
6.65 %
|
...
|
[46th of 164]
|
|
value added > constant 2000 US$
|
240,036,000 constant 2000 US$
|
...
|
[122nd of 164]
|
|
value added > constant LCU
|
10788230000 |
...
|
|
|
value added > current LCU
|
13476850000 |
...
|
|
|
value added > current US$
|
302,103,800 $
|
...
|
[121st of 172]
|
... View all Industry stats
SOURCES: World Development Indicators database
ALTERNATIVE NAMES:
Bhutan, Kingdom of Bhutan
Related links:
More facts and figures on Bhutan
|