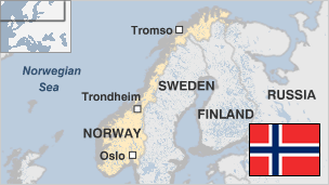
FACTOID # 3: The total area of Australia’s coral reefs is greater than the total area of some 130 individual countries.
 
 Home   Encyclopedia   Statistics   Countries A-Z   Flags   Maps   Education   Forum   FAQ   About 


WHAT'S NEW
 

SEARCH ALL

FACTS & STATISTICS   

Search encyclopedia, statistics and forums:


(* = Graphable)


Europe > Norway > Environment

NORWEGIAN ENVIRONMENT STATS:   Top Stats   All Stats  
View this page with:    Just Stats   Sources   Definitions   Both  
Areas under protection 178 [36th of 146]
Carbon efficiency 0.74 CO2 emissions/$ GDP [97th of 141]
CO2 Emissions 35,312.2 [60th of 178]
Ecological footprint 6.13 [18th of 141]
Endangered species protection 87% [43rd of 141]
Environmental agreement compliance 6.06 [7th of 70]
Known breeding bird species 241 [47th of 146]
Known mammal species 54 [133rd of 145]
Marine fish catch 2,551,180 tons [8th of 141]
NOx emissions per populated area 0.26 thousand metric tons/squ [64th of 141]
Pollution > Carbon Dioxide per capita 8 [18th of 29]
Protected area 6.8 [61st of 147]
SO2 emissions per populated area 350 thousand metric tons/squ [87th of 141]
Threatened species 16 [111st of 158]
Threatened species > Mammal 4 [141st of 160]
Water > Availability 57.71 thousand cubic metres [7th of 141]
Water > Freshwater pollution 0.2 tons/cubic km [51st of 69]
Water > Phosphorus concentration 0.01 mls/litre [139th of 141]
Wetlands of intl importance > Area 70 thousand hectares [72nd of 112]
Wildness 28.71% [39th of 141]

... View all Environment stats

SOURCES: World Resources Institute; Carbon Dioxide Information Analysis Center; World Resources Institute. 2003. Carbon Emissions from energy use and cement manufacturing, 1850 to 2000. Available on-line through the Climate Analysis Indicators Tool (CAIT) at Washington, DC: World Resources Institute; World Wide Fund for Nature (WWF), Living Planet Report 2000, Gland, Switzerland: 2000, and Redefining Progress.; Convention on International Trade in Endangered Species of Wild Fauna and Flora, Report on National Reports Required Under Article VIII, Paragraph 7(a), of the Convention, Eleventh Meeting of the Conference of the Parties, Gigiri, Kenya, April 2000; Michael E. Porter et al, The Global Competitveness Report 2001. Oxford: Oxford University Press, 2001. via ciesin.org; FAOSTAT on-line database; Intergovernmental Panel on Climate Change: Special Report on Emissions Scenarios, Data Version 1.1, B1Illustrative Marker Scenario with model IMAGE; Organization for Economic Cooperation and Development, Paris, France, OECD Environmental Data Compendium; Jacaranda Atlas; United Nations World Statistics Pocketbook and Statistical Yearbook; Center for Environmental Systems Research, University of Kassel, WaterGAP 2.1B, 2001 via ciesin.org; World Bank, World Development Indicators 2001, Washington, DC: World Bank, 2001 (for BOD emissions)and Center for Environmental Systems Research, University of Kassel, WaterGap 2.1, 2000 (for data on waterquantity). via ciesin.org; United Nations Environment Programme (UNEP), Global Environmental Monitoring System/Water Quality Monitoring System, with data for an additional 29 countries from Prescott-Allen, R. The Well being of Nations, Washington, DC: Island Press, 2001; Wild Areas Project (WAP), joint Wildlife Conservation Society (WCS) and CIESIN project to map the lastwild places on the earth's surface. via ciesin.org

ALTERNATIVE NAMES: Norway, Kingdom of Norway, Kongeriket Norge, Norge

Related links:

More facts and figures on Norway


COMMENTARY     


Share your thoughts, questions and commentary here
Your name
Your location
Your comments
Please enter the 5-letter protection code


Lesson Plans | Student Area | Student FAQ | Reviews | Press Releases |  Feeds | Contact
© Copyright NationMaster.com 2003-2008. All Rights Reserved. Usage implies agreement with terms.