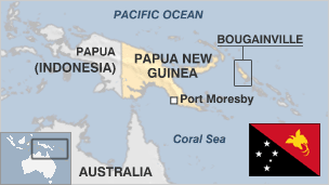
|
SEARCH ALL
|
FACTS & STATISTICS
|
|
Search encyclopedia, statistics and forums:
|
|
|
| PAPUA NEW GUINEAN INDUSTRY STATS: |
| Top Stats |
| | All Stats |
|
|
|
| |
|
|
|
Changes in inventories > current LCU
|
377000000 |
...
|
|
|
Changes in inventories > current US$
|
146,647,000 $
|
...
|
[48th of 138]
|
|
Chemicals > % of value added in manufacturing
|
5.76 %
|
...
|
[37th of 91]
|
|
Machinery and transport equipment > % of value added in manufacturing
|
8.28 %
|
...
|
[33rd of 91]
|
|
Manufactures exports > % of merchandise exports
|
5.61 %
|
...
|
[138th of 156]
|
|
Manufactures imports > % of merchandise imports
|
68.68 %
|
...
|
[82nd of 155]
|
|
Manufacturing, value added > annual % growth
|
5.54 %
|
...
|
[54th of 156]
|
|
Manufacturing, value added > constant 2000 US$
|
242,147,400 constant 2000 US$
|
...
|
[114th of 155]
|
|
Manufacturing, value added > constant LCU
|
305000000 |
...
|
|
|
Manufacturing, value added > current LCU
|
803000000 |
...
|
|
|
Manufacturing, value added > current US$
|
249,185,400 $
|
...
|
[118th of 167]
|
|
Ores and metals exports > % of merchandise exports
|
49.4 %
|
...
|
[3rd of 154]
|
|
Ores and metals imports > % of merchandise imports
|
0.48 %
|
...
|
[140th of 155]
|
|
Other manufacturing > % of value added in manufacturing
|
61.35 %
|
...
|
[10th of 107]
|
|
Textiles and clothing > % of value added in manufacturing
|
0.8 %
|
...
|
[91st of 101]
|
|
value added > annual % growth
|
4.01 %
|
...
|
[82nd of 164]
|
|
value added > constant 2000 US$
|
1,266,603,000 constant 2000 US$
|
...
|
[103rd of 164]
|
|
value added > constant LCU
|
1194000000 |
...
|
|
|
value added > current LCU
|
5028000000 |
...
|
|
|
value added > current US$
|
1,560,279,000 $
|
...
|
[100th of 172]
|
... View all Industry stats
SOURCES: World Development Indicators database
ALTERNATIVE NAMES:
Papua New Guinea, Independent State of Papua New Guinea, new guinea, papua n.g.
Related links:
|