
Facts and stats about South Africa
- Agriculture 193
- Background 12
- Conflict 12
- Cost of living 55
- Crime 105
- Culture 31
- Disasters 6
- Economy 3341
- Education 599
- Energy 1101
- Environment 250
- Geography 90
- Government 204
- Health 331
48.6 million
Population. Ranked 26th in 2013.
$7,507.67
GDP per capita. Ranked 68th in 2012.
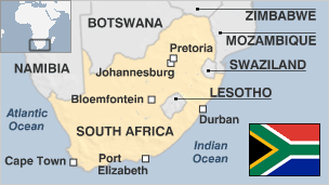
1.21 million sq km
Sq. km. Ranked 24th in 2008.