
Facts and stats about Singapore
- Agriculture 115
- Background 8
- Conflict 2
- Cost of living 55
- Crime 102
- Culture 26
- Disasters 17
- Economy 2867
- Education 345
- Energy 777
- Environment 184
- Geography 76
- Government 195
- Health 292
5.46 million
Population. Ranked 115th in 2013.
$51,709.45
GDP per capita. Ranked 9th in 2012.
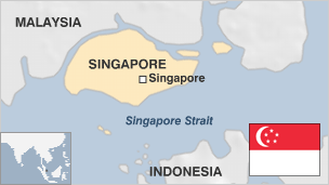
697 sq km
Sq. km. Ranked 175th in 2008.