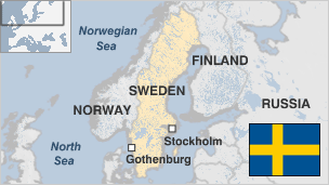
|
Alcohol consumption > 1960
|
4.8 litres per capita |
|
[19th of 24]
|
|
Alcohol consumption > 1970
|
7.2 litres per capita |
|
[19th of 26]
|
|
Alcohol consumption > 1980
|
6.7 litres per capita |
|
[25th of 29]
|
|
Alcohol consumption > 1990
|
6.4 litres per capita |
|
[26th of 30]
|
|
Alcohol consumption > 2000
|
6.2 litres per capita |
|
[26th of 30]
|
|
Alcohol consumption > Current
|
7 litres per capita |
|
[26th of 30]
|
|
Beer consumption
|
56 litres |
|
[15th of 18]
|
|
beverages and tobacco > % of value added in manufacturing
|
10.3 %
|
...
|
[63rd of 103]
|
|
Bottled water consumption
|
19.1 litres |
|
[12th of 18]
|
|
Coffee consumption
|
7.8 kgs |
|
[4th of 18]
|
|
exports > % of merchandise exports
|
3.47 %
|
...
|
[92nd of 156]
|
|
Fruit juice consumption
|
35.5 litres |
|
[5th of 18]
|
|
imports > % of merchandise imports
|
7.37 %
|
...
|
[76th of 155]
|
|
McDonalds restaurants
|
227 McDonald's restaurants |
|
[14th of 39]
|
|
Pork consumption per capita
|
79.4 |
|
[7th of 18]
|
|
Soft drink consumption
|
82.4 litres |
|
[10th of 18]
|
|
Subway resturants
|
10 |
|
[42nd of 82]
|
|
Tea consumption
|
0.4 kgs |
|
[9th of 18]
|
|
Total spirit consumption
|
2.9 litres |
|
[11th of 18]
|
|
Wine consumption
|
16 litres |
|
[12th of 18]
|