
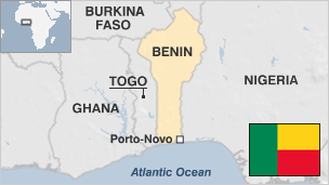
Facts and stats about Benin
- Agriculture 131
- Background 7
- Conflict 1
- Crime 23
- Culture 16
- Economy 2474
- Education 572
- Energy 496
- Environment 187
- Geography 79
- Government 214
- Health 337
- Import 2
- Industry 61
9.88 million
Population. Ranked 89th in 2013.
$751.92
GDP per capita. Ranked 155th in 2012.
110,620 sq km
Sq. km. Ranked 96th in 2008.
Benin is the first country in Africa that transitioned successfully from a dictatorship to a pluralistic political system. Yayi Boni assumed the presidency in 2006 in a presidential election described by political observers as free and fair. He was reelected to a second term in 2011. Under a new democracy, Benin’s economy started to grow. Tourism also flourished. However, a larger percentage of the local populace still depended on survival farming like growing beans, yams, corn, coffee, cocoa, and cotton.
Actually, it is recovering slowly after experiencing a gruelling period from 2009 until 2010. Growth reached 3.6 percent in 2012 and is estimated to become more established starting this year. Reforms are needed in the Port of Cotonou which is the biggest city and economic hub of Benin. Economists believe that there should also be efficient management of public finances, enhancement in administration and improvement of the business climate. The government also needs to address exploitation of agricultural and mining natural resources as well as deal with deficiencies in infrastructure and services.
Benin espouses press freedom. It is one of the major provisions of the constitution and widely respected by the government. However, President Thomas Boni Yayi adopted an old law that penalizes libel which led to the imprisonment of a political activist named Andoche Ameginesse who published a newspaper, “Anyone but Boni Yayi in 2011.” Access to information is not guaranteed by law. One third of Benin’s population lives below the standard poverty line of US$ 1.25 per day. Nevertheless, Yet, Benin generally respects human rights compared to other African nations.
jaacosta47 15 May 2014