
Facts and stats about Cameroon
- Agriculture 130
- Background 7
- Conflict 1
- Cost of living 51
- Crime 28
- Culture 16
- Economy 2825
- Education 392
- Energy 683
- Environment 198
- Geography 83
- Government 202
- Health 304
- Import 3
20.55 million
Population. Ranked 58th in 2013.
$1,151.36
GDP per capita. Ranked 143th in 2012.
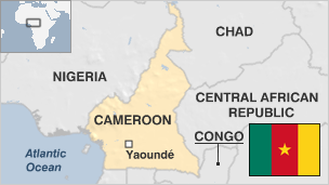
472,710 sq km
Sq. km. Ranked 49th in 2008.