
Facts and stats about Ethiopia
Author: Edsel.G
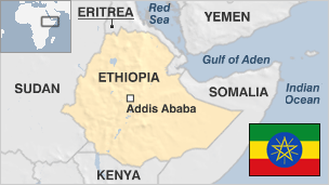
Ethiopia is a landlocked country located in the Horn of Africa and surrounded by several nations including Kenya, Somalia, Eritrea, Sudan, South Sudan, and Djibouti. Despite its not being connected to any body of open water, Ethiopia has a very dense population of 93 million individuals, making it the most populated landlocked country in the world, and the second most populated country in Africa.
Scientists discovered the very first Homo sapiens bones in the country, suggesting that Ethiopia may have been the site of some of the confirmed first human habitations in the world.
Ethiopia has gained international attention for being the only country in the whole of Africa to actually resist foreign invasion even by more powerful and more advanced European colonizers. In the late 1800s, European powers at the height of their might embarked on a global colonization campaigns. Many African countries were occupied in the period known as the Scramble for Africa, and many Africans were sent to other parts of the world as slaves. Only Ethiopia was able to fend off attempts by several European armies to set foot on Ethiopian land. In fact, today, many African nations make use of the colors of the Ethiopian flag to symbolize sovereignty and independence.
Despite the fact that the country sits along the long and mighty Nile, Ethiopia was plagued by severe famine in its recent history. Today, however, Ethiopia is on a rising pattern, and with its politics stabilizing, the GDP of the country has seen a massive resurgence. According to the IMF, the Ethiopian GDP is now the second largest in the whole of Africa.
- Agriculture 142
- Background 9
- Conflict 5
- Cost of living 53
- Crime 58
- Culture 19
- Economy 2661
- Education 596
- Energy 648
- Environment 221
- Geography 83
- Government 212
- Health 296
- Import 4
93.88 million
Population. Ranked 13th in 2013.
$470.22
GDP per capita. Ranked 171st in 2012.
1,000,000 sq km
Sq. km. Ranked 28th in 2008.