In response to Anonymous: Is U.S.A. a country or a continent?
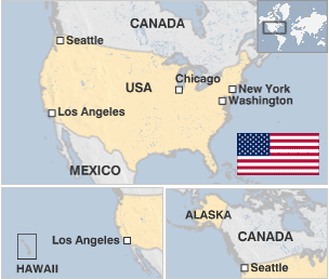
The title U.S.A. is the acronym for the United States of America which is a federal state. The greater continent of North America also encompasses Canada, another federal state and the second largest country in the world by land area, to the north and the United Mexican States to the south, another federal state. These three countries are the largest and northernmost of the North American landmass. To the south of Mexico lies a region known as Central America which includes the countries of Belize, Guatemala, El Salvador, Nicaragua, Honduras, Costa Rica and Panama. Although the region of Central America is, by name, distinct from North America when considering land connections this region could still fall into the realm of the North American continent. However, the same could be said about the connectivity of this region to the South American continent, which, due to historical and socio-economic reasons this region is more akin to South America, yet from a traditional political standpoint this region has been heavily influenced by North American foreign policy, primarily that of the United States of America. One simple way to make the distinction between North and South America is to look at the Panama Canal. With the completion and subsequent operation (partial handover to Panama in 1977 and full handover in 1999) of the Panama Canal by the United States has made the country of Panama a convenient location for the demarcation line between the contiguous land masses of North and South America. So, even though the total land area of Central America is relatively small, particularly when compared to the land masses both to the North and South, and lies entirely south of the Equator, in the greater geographical picture Central America can be considered part of the North American continent, the continent which the main landmass of the country of the United States of America (U.S.A.) is a part of. It should also be noted that the State of Hawaii lies in the South Pacific Ocean somewhat removed from the U.S.A. proper and the unincorporated territories of Puerto Rico (Caribbean region), Guam (North Pacific region) and the Philippines (Philippine Sea/ South China Sea region) as well as others, lie within regions which are remote from the North American landmass.
Shorty, you can see how much coal the United States consumed <a href= http://www.nationmaster.com/graph/ene_coa_con>here</a>, as well as its <a href= http://www.nationmaster.com/graph/ene_com_ene_use>commecial energy use</a>, <a href= http://www.nationmaster.com/graph/ene_ele_con>electricity consumption</a>, <a href= http://www.nationmaster.com/graph/ene_geo_pow_use>geothermal power use</a>, <a href= http://www.nationmaster.com/graph/ene_hyd_con>hydroelectricity consumption</a>, <a href= http://www.nationmaster.com/graph/ene_nat_gas_con>natural gas consumption</a>, <a href= http://www.nationmaster.com/graph/ene_nuc_ene_con>nuclear energy consumption</a>, <a href= http://www.nationmaster.com/graph/ene_oil_con>oil consumption</a> and overall <a href= http://www.nationmaster.com/graph/ene_usa_per_per>energy use per person. <p>To get a grasp on changes in consumption over time, check this data from 1965 on <a href= http://www.nationmaster.com/graph/ene_hyd_con_in_196>hydroelectricity consumption</a> and <a href= http://www.nationmaster.com/graph/ene_nuc_ene_con_in_196>nuclear energy consumption</a>. <p>There are also graphs on geothermal power use <a href= http://www.nationmaster.com/graph/ene_geo_pow_use_gdp>per $ GDP</a> and <a href= http://www.nationmaster.com/graph/ene_geo_pow_use_cap>per capita</a>, hydroelectricity consumption <a href= http://www.nationmaster.com/graph/ene_hyd_con_cap>per capita now</a> and <a href= http://www.nationmaster.com/graph/ene_hyd_con_cap>in 1965</a>, nuclear energy consumption per capita <a href= http://www.nationmaster.com/graph/ene_nuc_ene_con_cap>now </a> and <a href= http://www.nationmaster.com/graph/ene_nuc_ene_con_in_196_cap>in 1965</a>.
According to estimates by U.S. Citizenship and Immigration Services, there were about 5 million undocumented (or illegal) immigrants in the <a href= http://www.nationmaster.com/country/us>United States</a> in 1996, and the number was estimated to be growing by about 275,000 per year, on average. <p>About 2.7 million, or 54 percent of illegal aliens are believed to have come from <a href= http://www.nationmaster.com/country/mx>Mexico</a>, with an estimated 150,000 more arriving each year. Other countries that are a source of large numbers of illegal aliens include a<a href= http://www.nationmaster.com/country/es/>El Salvador</a>, <a href= http://www.nationmaster.com/country/gt>Guatemala</a>, <a href= http://www.nationmaster.com/country/ca>Canada</a>, <a href= http://www.nationmaster.com/country/ha>Haiti</a>, the <a href= http://www.nationmaster.com/country/rp>Philippines</a>, <a href= http://www.nationmaster.com/country/ho/>Honduras</a>, <a href= http://www.nationmaster.com/country/pl>Poland</a>, <a href= http://www.nationmaster.com/country/nu>Nicaragua</a>, the <a href= http://www.nationmaster.com/country/bf/>Bahamas</a>, <a href= http://www.nationmaster.com/country/co/>Colombia</a>, <a href= http://www.nationmaster.com/country/ec/>Ecuador</a>, the <a href= http://www.nationmaster.com/country/dr>Dominican Republic</a>, <a href= http://www.nationmaster.com/country/td/>Trinidad & Tobago</a>, and <a href= http://www.nationmaster.com/country/jm>Jamaica</a>, all of which are believed to sources of more than 50,000 illegal aliens in the U.S. These countries account for 82 percent of all illegal aliens in the country. <p>Approximately 2 million, or 40 percent, of undocumented aliens are nonimmigrant overstays who entered the country legally and didn’t depart. Around 16 percent of illegal aliens from Mexico are nonimmigrant overstays, compared to 26 percent of those from <a href= http://www.nationmaster.com/encyclopedia/Central-America>Central American</a> countries and 91 percent from all other countries. <p>All told, illegal aliens make up 1.9 percent of the total population of the U.S.
Vanessa, the <a href=http://www.nationmaster.com/red/graph/eco_inc_dis_poo_10&int=-1>poorest 10 percent</a> of people in the United States earn 1.8 percent of the income, while the <a href=http://www.nationmaster.com/graph/eco_inc_dis_ric_10>richest 10 percent</a> earn 30.5 percent of the income, or almost 17 times as much. <p>The <a href=http://www.nationmaster.com/graph/eco_inc_dis_poo_20>poorest 20 percent</a> of Americans earn 5.2 percent of the income, compared to the 46.4 percent of income which goes to the <a href=http://www.nationmaster.com/graph/eco_inc_dis_ric_20>richest 20 percent</a>. The average wage for a person in the top 20 percent is about 9 times as much as that of a person in the poorest 20 percent. <p>Based on the income distribution to the richest and poorest fifths of the population, we can deduce that the other 60 percent of Americans earn 49.4 percent of the income. That means they earn an average of about three times as much as the people in the poorest 20 percent and about one-third as much as the richest 20 percent. <p>Keep in mind, these averages reveal very little about the overall difference between various income earners because there is a wide range of income distribution within each of the lower, middle and upper classes.
The tobacco statistics don’t have information on how many Americans smoke or the total number of cigarettes consumed annually in the United States, but there are pages showing the <a href= http://www.nationmaster.com/graph/hea_tob_cig_imp>number of cigarettes the United States imported in 2000</a>, as well as <a href= http://www.nationmaster.com/graph/hea_tob_cig_imp_cap>per capita cigarette imports</a> and <a href= http://www.nationmaster.com/graph/hea_tob_cig_imp_gdp>cigarette imports per $ GDP</a> for the same year. <p>Other tobacco-related stats include <a href= http://www.nationmaster.com/graph/hea_tob_adu_mal_smo>adult male smokers</a>, <a href= http://www.nationmaster.com/graph/hea_tob_adu_fem_smo>adult female smokers</a> and <a href= http://www.nationmaster.com/graph/hea_tob_tot_adu_smo>total adult smokers</a>. There are also stats on <a href= http://www.nationmaster.com/graph/hea_tob_cig_con>cigarette consumption</a>, <a href= http://www.nationmaster.com/graph/hea_tob_tot_you_smo>total young smokers</a>, <a href= http://www.nationmaster.com/graph/hea_tob_you_fem_smo>young female smokers</a> and <a href= http://www.nationmaster.com/graph/hea_tob_you_mal_smo>young male smokers</a>.
In response to Heather:
<p>The <a href=http://www.nationmaster.com/graph/peo_div_rat>divorce rate</a> in the United States is 4.95 per 1000 people per year. This means that approximately 1,437,000 people (718,500 couples) will divorce each year (1968 couples per day).</p><p>The divorce rate in the United States <em>per population</em> is the highest in the world. This is partly due to the <a href=/graph/peo_mar_rat>marriage rate</a> which is also the highest in the world (more marriages will potentially lead to more divorces).</p><p>To take the marriage rate into consideration when comparing divorce rates, the number of <a href=/graph/peo_div_per_100_mar>divorces per 100 marriages</a> should be consulted. For the United States this rate is 49%, Lower than Belarus 68%, The Russian Federation 65%, Sweden 64%, Latvia 63%, Ukraine 63% The Czech Republic 61%, Belgium 56%, Finland 56%, Lithuania 55% The United Kingdom 53% and Moldova 52%.</p>
Posted on 26 Apr 2005
Edria Murray, Staff Editor
In response to Heather:
<p>The main religions in Canada are Roman Catholic 46% and Protestant 36%. Other major religious groups include: Christian Orthodox 1.49%, Christian (other)2.42%, Muslim 1.80%, Jewish 1.02%, Buddhist 0.93%, Hindu 0.92%, Sikh 0.86%, Other Eastern religions 0.12%, Other religions 0.20% and no religious affiliation 15.21%.</p>
<p>In the United States the largest religion is Christianity 77.30% (Protestant 53%, Catholic 23% Other Christian 1.3%) Other major religious groups include Judaism 1.38%, Islam 0.54%, Buddhism 0.53%, Hinduism 0.37%, Unitarian / universalist 0.31%, Wiccan/Pagan/Druid 0.11%, Spiritualist 0.04%,
Native American religions 0.05%, Baha'i 0.04%, New age 0.02%, Sikhism 0.03%, Scientology 0.03%, Humanist 0.02%, Deity 0.02%, Taoist 0.02%, Eckankar 0.01% and no religious affiliation 14.18%</p>
<p>The main religions in Mexico are nominally Roman Catholic 89%, Protestant 6%, other 5%.</p>
<p>As religious statistics are usually based on self identification and do not necessarily reflect <a href=http://www.nationmaster.com/graph/rel_chu_att>religious service attendance</a> or participation in other religious activities.</p>
<p>For further information on religion in North America see the <a href=http://www.nationmaster.com/graph/rel_rel>religions</a> page in the <a href=cat/Religion>religion</a> category.</p>
Posted on 26 Apr 2005
Edria Murray, Staff Editor
In response to <i>April</i> - according to the <a href=http://www.endhomelessness.org/index.htm>National Alliance to End Homelessness</a>, there are about <a href=http://www.hoopsforthehomeless.org/pressroom/PDF/HoopsPaperFinal.pdf>100,000 families homeless in the USA</a>. More basic facts are available at: http://www.endhomelessness.org/back/index.htm.
Posted on 25 Apr 2005
Suchita Vemuri, Staff Editor
In response to Susan:<br>
The <a href=/cat/Immigration>immigration</a> category covers imigration and emigration. Statistics in this category you may be interested in include:
<ul>
<li><a href=/red/graph/imm_net_mig_rat&int=-1>Net migration rate</a> - Countries which have more people arriving than leaving have a positive net migration rate, Those with a greater number of people leaving have a negative rate.</li>
<li><a href=/graph/imm_asy_see>Asylum seekers</a>.</li>
<li><a href=/graph/imm_for_pop>Foreign population</a> - The proportion of the population who are immigrants.</li>
<li><a href=/graph/imm_new_cit>New citizenships.</a></li>
</ul>
For statistics specifically related to entry into the United States, see also:
<ul>
<li><a href=/graph/imm_ref_us_app>Applications </a>. to the United States for refugee status.</li>
<li>Refugee applications to the United States which were <a href=/graph/imm_ref_us_app_app>accepted</a>, <a href=/graph/imm_ref_us_app_den>denied</a> and <a href=/graph/imm_ref_us_app_oth_clo>otherwise closed</a>.</li>
<li>United States <a href=/graph/imm_us_vis_lot_win>visa lottery winners</a>.</li>
</ul>
Posted on 19 Apr 2005
Edria Murray, Staff Editor
In response to <em>Tommy</em>: <p>Smoking related illnesses kill more than 400,000 Americans (around 276,000 men and 142,000 women) each year. This amounts to one fifth of all deaths.</p><p>For information on the death rate from specific smoking-related illnesses, see my detailed response to <em>Mark</em> (dated 2005-04-05) on this board. </p>
Posted on 12 Apr 2005
Edria Murray, Staff Editor
In response to <i>Mark</i>:<p>Determining the number of people who have died from tobacco related illnesses is difficult as some non-smokers also die from these diseases. </p><p>Lung cancer, for example is generally considered a smoker's disease as 84% of cases are believed to have been caused by Tobacco smoking. Other factors which medical professionals believe to cause lung cancer include passive smoking, Asbestos, Radon exposure, Workplace carcinogens (such as arsenic, vinyl chloride and Chlorine gas, Talcum powder), Marijuana smoking, Recurrent infection, Genetic factors, Vitamin A deficiency or excess and Air pollution.</p><p>According to ASH (Action on Smoking and Health), Smoking is responsible for deaths from the following diseases:<ul><li><b><a href=/graph/hea_dea_fro_can>Cancers</a></b> <a href=/graph/mor_mal_neo_of_bro_and_lun>lung</a>(84% of deaths), <a href=/graph/mor_car_in_sit_of_mid_ear_and_res_sys>Upper respiratory</a> (66%), Oesophagus (68%),<a href=/graph/mor_mal_neo_of_bla>Bladder</a> (37%), <a href=/graph/mor_mal_neo_of_kid_exc_ren_pel>Kidney</a> (27%), <a href=/graph/mor_mal_neo_of_sto>Stomach</a> (26%), <a href=/graph/mor_mal_neo_of_pan>Pancreas</a> (23%), <a href=/graph/mor_mye_leu>Myeloid Leukaemia</a> (15%)</li><li><B><a href=/graph/hea_res_dis_dea>Respiratory diseases</a></b> Chronic obstructive lung disease (84%), Pneumonia (17%) </li><li><b><a href=/graph/hea_cir_dis_dea>Circulatory diseases</a></b> Ischaemic heart disease (17%), Cerebrovascular disease (10%), Aortic aneurysm (57%), Myocardial degeneration (15%), Atherosclerosis (10%)</li><li><b><a href=/graph/hea_dig_dis_dea>Digestive diseases</a></b> Ulcers of the <a href=/graph/mor_gas_ulc>stomach</a> or <a href=/graph/mor_duo_ulc>duodenum</a> (45%)</li></ul>Statistics on death from many of these specific diseases can be found in the <a href=/cat/Mortality>mortality category</a><p> In addition to this, tobacco smoking also:<ul><li>Worsens symptoms of some diseases including Asthma, Graves’ disease (over-active thyroid gland) and Chronic rhinitis (chronic inflammation of the nose)</li><li>Reduces function of the immune and reproductive system</li><li>Increses the risk of other medical conditions including those affecting the eyes, teeth and gums, muscles, ligaments and tendons, reproductive system and skin.</li></ul></p><p>The effect of smoking depends on the amount a person smokes and the length of time that they have been smoking. After the person stops smoking, their body begins to repair the damage, however even after ten years, the ex-smoker's risk still does not equal the lower risk of a person who never smoked.</p>
Posted on 05 Apr 2005
Edria Murray, Staff Editor
In response to <i>Bellitbutton</i> - Facts on the December 26 Tsunami including the <a href=/graph/dis_tsu_dea_tol>death toll</a>, <a href=/graph/dis_tsu_eco_imp>economic impact</a> and <a href=/graph/dis_tsu_int_aid_pac>international aid packages</a> can be found in the <a href=/cat/Disasters>Disasters</a> category.</p><p>For further information on Tsunami waves enter Tsunami in the <a href=http://www.factbites.com>factbites</a> search box. </p>
Posted on 28 Mar 2005
Edria Murray, Staff editor
Hi Steve, the ratios would continue to be be more or less in line with the <a href=http://www.findarticles.com/p/articles/mi_m2744/is_6_2004/ai_n6121363>Energy Information Administration\'s March 2004 report</a>, which stated that, in the USA, of total energy consumption, the residential sector accounted for about 22% of total energy consumption, the commercial sector about 18%, the industrial sector about 33%, transportation about 27%.
Posted on 24 Mar 2005
Suchita Vemuri, Staff Editor
Hi Chan, The total <a href=http://www.wrm.org.uy/deforestation/UNreport.html>forest area lost</a> between 1980 and 1995 was more than 220 million hectares, much larger than the total land area of Mexico. You may also want to see a short run-down of the <a href=http://www.nationmaster.com/graph/env_cur_iss>environmental issues</a> before various countries as well as the <a href=http://www.nationmaster.com/graph/env_wil>area of wilderness</a> in each country. Also see: http://www.fao.org/forestry/foris/webview/forestry2/index.jsp?siteId=5621&sitetreeId=22027&langId=1&geoId=0
Posted on 14 Mar 2005
Suchita Vemuri, Staff Editor
Response to Led -- follow the links for <a href=http://www.nationmaster.com/encyclopedia/National-Historic-Landmark#Maine_.2840.29>Maine</a>, <a href=http://www.nationmaster.com/encyclopedia/National-Historic-Landmark#Vermont_.2817.29Vermont</a> and <a href=http://www.nationmaster.com/encyclopedia/National-Historic-Landmark#New_Hampshire_.2822.29>New Hampshire</a> from: http://www.nationmaster.com/encyclopedia/National-Historic-Landmark.
Posted on 14 Mar 2005
Suchita Vemuri, Staff Editor
Hi Ted, the latest data, which was reported in 2003, is for 2000 and shows that there were 1.3 million <a href=http://www.guttmacher.org/presentations/abort_slides.pdf>abortions in the USA</a>, which emans that about 2.1% of women between 15 and 44 had an abortion. <a href=http://www.guttmacher.org/pubs/state_ab_pt.html>State-wise data</a> is also available. For data on trends from 1980, see: http://www.guttmacher.org/sections/abortion.html or http://www.wedo.org/.
Posted on 14 Mar 2005
Suchita Vemuri, Staff Editor
In response to <i>Blossom:</i></p><p>For information on the average hours spent in a classroom, refer to hours of instruction for pupils age <a href=/graph/edu_hou_of_ins_for_pup_age_9>9</a>, <a href=/graph/edu_hou_of_ins_for_pup_age_10>10</a>, <a href=/graph/edu_hou_of_ins_for_pup_age_11>11</a>, <a href=/graph/edu_hou_of_ins_for_pup_age_12>12</a> and<a href=/graph/edu_hou_of_ins_for_pup_age_13>13</a>.</p><p>For information on how this time is used in elementary school level refer to the proportion of primary education time spent learning <a href=/graph/edu_pro_of_pri_edu_tim_spe_in_phy_edu>physical education</a>, <a href=/graph/edu_pro_of_pri_edu_tim_spe_lea_art>arts</a>, <a href=/graph/edu_pro_of_pri_edu_tim_spe_lea_for_lan>foreign languages</a>, <a href=/graph/edu_pro_of_pri_edu_tim_spe_lea_mat>mathematics</a>, <a href=/graph/edu_pro_of_pri_edu_tim_spe_lea_mot_ton>mother tongue</a>, <a href=/graph/edu_pro_of_pri_edu_tim_spe_lea_rel>religion</a>, <a href=/graph/edu_pro_of_pri_edu_tim_spe_lea_sci>science</a>, <a href=/graph/edu_pro_of_pri_edu_tim_spe_lea_soc_stu>social studies</a>, <a href=/graph/edu_pro_of_pri_edu_tim_spe_lea_tec>technology</a> and <a href=/graph/edu_pro_of_pri_edu_tim_spe_lea_voc_ski>vocational skills</a>. </p>
Posted on 04 Mar 2005
Edria Murray, Staff editor
In response to <i>Crap Face</i>,</p>
<p>For information on the use of recreational drugs, see the usage rates of <a href=/graph/lif_amp_use&int=-1>amphetamines</a>, <a href=/graph/lif_can_use>cannabis</a>, alcohol (<a href=/graph/lif_tot_spi_con&int=-1>spirits</a>, <a href=graph/lif_bee_con&int=-1>beer</a>,
<a href=/graph/lif_win_con&int=-1>wine</a>) and <a href=/graph/hea_tob_tot_adu_smo&int=-1>tobacco</a> in the <a href=/cat/Lifestyle>lifestyle</a> category.
</p>
Posted on 04 Mar 2005
Edria Murray, Staff editor
he term Latin refers to many things. First it means the language of ancient Italy. Nowadays it is also used on anythings it has to do with Italy, Spain and even Portugal some times. A term which applies to central and south america is Latin America because of the fact that they were once colonies of latin countries. (Spain and Portugal) So in the USA the term Latinos is now used for people from Latin America and not for people from the three european Latin countries. A similar example is the term Hispanics which is used for Latin-American immigrants mainly from Mexico (once a part of the kingdom of Spain) and not for someone who comes from Spain. (thats why the term is called "hispanic" and not "spanish" . <a href="http://www.citazioni-celebri.com/category/proverbi/">proverbi</a>