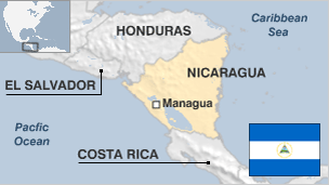
FACTOID #
173:
More than half of all doctors in
Finland
are
female
.
Interesting health facts
»
Home
Encyclopedia
Statistics
Countries A-Z
Flags
Maps
Education
Forum
FAQ
About
WHAT'S NEW
Announcing TheFullWiki
Feature update
CIA update and time
»
December update
Hiring: Full time web
»
FACTS & STATISTICS
Simple view
Select countries to view:
(hold down Control key and click to select several)
Compare:
All
Top 5
Top 10
Top 20
Top 50
Top 100
Bottom 100
Bottom 20
Bottom 10
Bottom 5
All (desc)
Select fact or statistic:
(* = graphable)
Select Category
Agriculture
Background
Crime
Currency
Democracy
Disasters
Economy
Education
Energy
Environment
Food
Geography
Government
Health
Identification
Immigration
Industry
Internet
Labor
Language
Lifestyle
Media
Military
Mortality
People
Religion
Sports
Taxation
Terrorism
Transportation
(OPTIONAL) Compare to statistic:
(both need to be graphable)
Select Category
Agriculture
Background
Crime
Currency
Democracy
Disasters
Economy
Education
Energy
Environment
Food
Geography
Government
Health
Identification
Immigration
Industry
Internet
Labor
Language
Lifestyle
Media
Military
Mortality
People
Religion
Sports
Taxation
Terrorism
Transportation
View result as:
Map & graph / table
Correlations
Pie chart
Scatterplot with ...
Flags
Circles (same size)
Circles (size by population)
Circles (size by GDP)
Circles (size by land area)
(OR) SEARCH ALL
encyclopedia, stats & forums:
Central America and the Caribbean
>
Nicaragua
> Bottom Rankings
View full size
VIEW STATS:
Popular
All stats
Last
Agriculture > Agricultural land > % of land area
Agriculture > Agricultural land > sq. km
Agriculture > Agricultural machinery > tractors
Agriculture > Agricultural machinery > tractors per 100 hectares of arable land
Agriculture > Agricultural machinery > tractors (per capita)
Agriculture > Agricultural raw materials exports > % of merchandise exports
Agriculture > Agricultural raw materials imports > % of merchandise imports
Agriculture > Agriculture, value added > constant 2000 US$ (per capita)
Agriculture > Agriculture, value added > current US$ (per capita)
Agriculture > Agriculture, value added > current US$ (per $ GDP)
Agriculture > Arable land > hectares
Agriculture > Arable land > % of land area
Agriculture > Cereal yield > kg per hectare
Agriculture > Fertilizer consumption > 100 grams per hectare of arable land
Agriculture > Fertilizer consumption > metric tons
Agriculture > Fertilizer consumption > metric tons (per capita)
Agriculture > Irrigated land > % of cropland
Agriculture > Land under cereal production > hectares
Agriculture > Land under cereal production > hectares (per capita)
Agriculture > Permanent cropland > % of land area
Agriculture > value added > annual % growth
Agriculture > value added > constant 2000 US$
Agriculture > value added > constant 2000 US$ (per capita)
Agriculture > value added > current US$
Agriculture > value added > current US$ (per capita)
Agriculture > value added > current US$ (per $ GDP)
Agriculture > value added per worker > constant 2000 US$
Crime > > % of managers surveyed ranking this as a major business constraint
Currency > PPP conversion factor to official exchange rate ratio
Currency > Real effective exchange rate index
Democracy > CPIA gender equality rating
Democracy > CPIA policies for social inclusion/equity cluster average
Democracy > CPIA property rights and rule-based governance rating
Democracy > CPIA public sector management and institutions cluster average
Democracy > CPIA transparency, accountability, and corruption in the public sector rating
Economy > Adjusted net savings, excluding particulate emission damage > % of GNI
Economy > Adjusted net savings, including particulate emission damage > % of GNI
Economy > Adjusted savings: consumption of fixed capital > % of GNI
Economy > Adjusted savings: gross savings > % of GNI
Economy > Adjusted savings: net national savings > % of GNI
Economy > Bank and trade-related lending > PPG + PNG > NFL, current US$
Economy > Bank and trade-related lending > PPG + PNG > NFL, current US$ (per capita)
Economy > Bank and trade-related lending > PPG + PNG > NFL, current US$ (per $ GDP)
Economy > Bank capital to assets ratio > %
Economy > Bank nonperfoming loans to total gross loans > %
Economy > Business disclosure index
Economy > Cash surplus/deficit > % of GDP
Economy > Changes in net reserves > BoP, current US$
Economy > Changes in net reserves > BoP, current US$ (per capita)
Economy > Changes in net reserves > BoP, current US$ (per $ GDP)
Economy > Claims on governments, etc. > annual growth as % of M2
Economy > Commercial service exports > current US$
Economy > Commercial service exports > current US$ (per capita)
Economy > Commercial service exports > current US$ (per $ GDP)
Economy > Commercial service imports > current US$
Economy > Commercial service imports > current US$ (per capita)
Economy > Commercial service imports > current US$ (per $ GDP)
Economy > Cost of business start-up procedures > % of GNI per capita
Economy > CPIA business regulatory environment rating
Economy > CPIA debt policy rating
Economy > CPIA economic management cluster average
Economy > CPIA efficiency of revenue mobilization rating
Economy > CPIA financial sector rating
Economy > CPIA macroeconomic management rating
Economy > CPIA quality of budgetary and financial management rating
Economy > CPIA structural policies cluster average
Economy > CPIA trade rating
Economy > Credit information availability index
Economy > Current account balance > BoP, current US$
Economy > Current account balance > BoP, current US$ (per capita)
Economy > Current account balance > BoP, current US$ (per $ GDP)
Economy > Current account balance > % of GDP
Economy > Current transfers, receipts > BoP, current US$
Economy > Current transfers, receipts > BoP, current US$ (per capita)
Economy > Deposit interest rate > %
Economy > Domestic credit provided by banking sector > % of GDP
Economy > Domestic credit to private sector > % of GDP
Economy > Ease of doing business index
Economy > Expense > % of GDP
Economy > Exports of goods and services > annual % growth
Economy > Exports of goods and services > BoP, current US$
Economy > Exports of goods and services > BoP, current US$ (per capita)
Economy > Exports of goods and services > BoP, current US$ (per $ GDP)
Economy > Exports of goods and services > constant 2000 US$
Economy > Exports of goods and services > constant 2000 US$ (per capita)
Economy > Exports of goods and services > current US$
Economy > Exports of goods and services > current US$ (per capita)
Economy > Exports of goods and services > current US$ (per $ GDP)
Economy > Exports of goods and services > % of GDP
Economy > Exports of goods, services and income > BoP, current US$
Economy > Exports of goods, services and income > BoP, current US$ (per capita)
Economy > Exports of goods, services and income > BoP, current US$ (per $ GDP)
Economy > Export quantum/quantity index
Economy > Export value index
Economy > External balance on goods and services > current US$
Economy > External balance on goods and services > current US$ (per capita)
Economy > External balance on goods and services > current US$ (per $ GDP)
Economy > External balance on goods and services > % of GDP
Economy > External debt, total > DOD, current US$
Economy > External debt, total > DOD, current US$ (per capita)
Economy > Final consumption expenditure, etc. > annual % growth
Economy > Final consumption expenditure, etc. > constant 2000 US$
Economy > Final consumption expenditure, etc. > constant 2000 US$ (per capita)
Economy > Final consumption expenditure, etc. > current US$
Economy > Final consumption expenditure, etc. > current US$ (per capita)
Economy > Financial information infrastructure index
Economy > Foreign direct investment, net > BoP, current US$
Economy > Foreign direct investment, net > BoP, current US$ (per capita)
Economy > Foreign direct investment, net inflows > BoP, current US$
Economy > Foreign direct investment, net inflows > BoP, current US$ (per capita)
Economy > Foreign direct investment, net inflows > BoP, current US$ (per $ GDP)
Economy > Foreign direct investment, net inflows > % of GDP
Economy > GDP > constant 2000 US$
Economy > GDP > constant 2000 US$ (per capita)
Economy > GDP deflator
Economy > GDP growth > annual %
Economy > GDP per capita > constant 2000 US$
Economy > GDP per capita growth > annual %
Economy > GDP per capita, PPP > constant 2000 international $
Economy > GDP per capita, PPP > current international $
Economy > GDP per unit of energy use
Economy > GDP, PPP > constant 2000 international $
Economy > GDP, PPP > constant 2000 international $ (per capita)
Economy > GDP, PPP > current international $
Economy > GDP, PPP > current international $ (per capita)
Economy > GNI, Atlas method > current US$
Economy > GNI, Atlas method > current US$ (per capita)
Economy > GNI, Atlas method > current US$ (per $ GDP)
Economy > GNI > current US$
Economy > GNI > current US$ (per capita)
Economy > GNI > current US$ (per $ GDP)
Economy > GNI, PPP > current international $
Economy > GNI, PPP > current international $ (per capita)
Economy > Goods and services expense > % of expense
Economy > Goods exports > BoP, current US$
Economy > Goods exports > BoP, current US$ (per capita)
Economy > Goods exports > BoP, current US$ (per $ GDP)
Economy > Goods imports > BoP, current US$
Economy > Goods imports > BoP, current US$ (per capita)
Economy > Grants and other revenue > % of revenue
Economy > Gross capital formation > annual % growth
Economy > Gross capital formation > constant 2000 US$
Economy > Gross capital formation > constant 2000 US$ (per capita)
Economy > Gross capital formation > current US$
Economy > Gross capital formation > current US$ (per capita)
Economy > Gross domestic savings > current US$
Economy > Gross domestic savings > current US$ (per capita)
Economy > Gross domestic savings > current US$ (per $ GDP)
Economy > Gross fixed capital formation > annual % growth
Economy > Gross fixed capital formation > constant 2000 US$
Economy > Gross fixed capital formation > constant 2000 US$ (per capita)
Economy > Gross fixed capital formation > current US$
Economy > Gross fixed capital formation > current US$ (per capita)
Economy > Gross national expenditure > constant 2000 US$
Economy > Gross national expenditure > constant 2000 US$ (per capita)
Economy > Gross national expenditure > current US$
Economy > Gross national expenditure > current US$ (per capita)
Economy > Gross private capital flows > % of GDP
Economy > Gross savings > current US$
Economy > Gross savings > current US$ (per capita)
Economy > Gross savings > current US$ (per $ GDP)
Economy > Gross savings > % of GNI
Economy > Gross value added at factor cost > constant 2000 US$
Economy > Gross value added at factor cost > constant 2000 US$ (per capita)
Economy > Gross value added at factor cost > current US$
Economy > Gross value added at factor cost > current US$ (per capita)
Economy > High-technology exports > current US$
Economy > High-technology exports > current US$ (per capita)
Economy > High-technology exports > current US$ (per $ GDP)
Economy > High-technology exports > % of manufactured exports
Economy > Household final consumption expenditure > annual % growth
Economy > Household final consumption expenditure > constant 2000 US$
Economy > Household final consumption expenditure > constant 2000 US$ (per capita)
Economy > Household final consumption expenditure > current US$
Economy > Household final consumption expenditure > current US$ (per capita)
Economy > Household final consumption expenditure, etc. > annual % growth
Economy > Household final consumption expenditure, etc. > constant 2000 US$
Economy > Household final consumption expenditure, etc. > constant 2000 US$ (per capita)
Economy > Household final consumption expenditure, etc. > current US$
Economy > Household final consumption expenditure, etc. > current US$ (per capita)
Economy > Household final consumption expenditure per capita > constant 2000 US$
Economy > Household final consumption expenditure per capita growth > annual %
Economy > IBRD loans and IDA credits > PPG DOD, current US$
Economy > IDA resource allocation index
Economy > Imports of goods and services > annual % growth
Economy > Imports of goods and services > BoP, current US$
Economy > Imports of goods and services > BoP, current US$ (per capita)
Economy > Imports of goods and services > constant 2000 US$
Economy > Imports of goods and services > constant 2000 US$ (per capita)
Economy > Imports of goods and services > current US$
Economy > Imports of goods and services > current US$ (per capita)
Economy > Imports of goods and services > current US$ (per $ GDP)
Economy > Imports of goods, services and income > BoP, current US$
Economy > Imports of goods, services and income > BoP, current US$ (per capita)
Economy > Imports of goods, services and income > BoP, current US$ (per $ GDP)
Economy > Import quantum/quantity index
Economy > Import value index
Economy > Income payments > BoP, current US$
Economy > Income payments > BoP, current US$ (per capita)
Economy > Income payments > BoP, current US$ (per $ GDP)
Economy > Income receipts > BoP, current US$
Economy > Income receipts > BoP, current US$ (per capita)
Economy > Income receipts > BoP, current US$ (per $ GDP)
Economy > Insurance and financial services > % of commercial service exports
Economy > Insurance and financial services > % of commercial service imports
Economy > Interest payments > % of expense
Economy > Interest payments > % of revenue
Economy > Interest rate spread > lending rate minus deposit rate
Economy > International tourism, expenditures > current US$
Economy > International tourism, expenditures > current US$ (per capita)
Economy > International tourism, expenditures > current US$ (per $ GDP)
Economy > International tourism, expenditures > % of total imports
Economy > International tourism, number of arrivals
Economy > International tourism, number of departures
Economy > International tourism, receipts > current US$
Economy > International tourism, receipts > current US$ (per capita)
Economy > International tourism, receipts > current US$ (per $ GDP)
Economy > International tourism, receipts > % of total exports
Economy > Legal rights of borrowers and lenders index
Economy > Lending interest rate > %
Economy > Liquid liabilities (M3) as % of GDP
Economy > Long-term debt > DOD, current US$
Economy > Long-term debt > DOD, current US$ (per capita)
Economy > Merchandise exports > current US$
Economy > Merchandise exports > current US$ (per capita)
Economy > Merchandise exports > current US$ (per $ GDP)
Economy > Merchandise imports > current US$
Economy > Merchandise imports > current US$ (per capita)
Economy > Merchandise imports > current US$ (per $ GDP)
Economy > Merchandise trade > % of GDP
Economy > Micro, small and medium enterprises > number (per capita)
Economy > Money and quasi money growth > annual %
Economy > Money and quasi money (M2) as % of GDP
Economy > Money and quasi money (M2) to total reserves ratio
Economy > Multilateral debt service > % of public and publicly guaranteed debt service
Economy > Net barter terms of trade
Economy > Net current transfers > BoP, current US$
Economy > Net current transfers > BoP, current US$ (per capita)
Economy > Net errors and omissions, adjusted > BoP, current US$
Economy > Net errors and omissions, adjusted > BoP, current US$ (per capita)
Economy > Net errors and omissions, adjusted > BoP, current US$ (per $ GDP)
Economy > Net financial flows, IBRD > current US$
Economy > Net financial flows, IBRD > current US$ (per capita)
Economy > Net financial flows, IBRD > current US$ (per $ GDP)
Economy > Net financial flows, IMF concessional > current US$ (per capita)
Economy > Net financial flows, IMF nonconcessional > current US$ (per capita)
Economy > Net financial flows, IMF nonconcessional > current US$ (per $ GDP)
Economy > Net financial flows, RDB nonconcessional > current US$
Economy > Net financial flows, RDB nonconcessional > current US$ (per capita)
Economy > Net financial flows, RDB nonconcessional > current US$ (per $ GDP)
Economy > Net income > BoP, current US$
Economy > Net income > BoP, current US$ (per capita)
Economy > Net income > BoP, current US$ (per $ GDP)
Economy > Net income from abroad > current US$
Economy > Net income from abroad > current US$ (per capita)
Economy > Net income from abroad > current US$ (per $ GDP)
Economy > Net trade in goods and services > BoP, current US$
Economy > Net trade in goods and services > BoP, current US$ (per capita)
Economy > Net trade in goods and services > BoP, current US$ (per $ GDP)
Economy > Net trade in goods > BoP, current US$
Economy > Net trade in goods > BoP, current US$ (per capita)
Economy > Net trade in goods > BoP, current US$ (per $ GDP)
Economy > Other expense > % of expense
Economy > Portfolio investment, bonds > PPG + PNG > NFL, current US$ (per capita)
Economy > Portfolio investment, bonds > PPG + PNG > NFL, current US$ (per $ GDP)
Economy > Present value of debt > % of exports of goods and services
Economy > Present value of debt > % of GNI
Economy > Private credit bureau coverage > % of adults
Economy > Private nonguaranteed debt > DOD, current US$
Economy > Private nonguaranteed debt > DOD, current US$ (per capita)
Economy > Private nonguaranteed debt > DOD, current US$ (per $ GDP)
Economy > Public and publicly guaranteed debt service > % of exports
Economy > Public and publicly guaranteed debt service > % of GNI
Economy > Public and publicly guaranteed debt service > TDS, current US$
Economy > Public and publicly guaranteed debt service > TDS, current US$ (per capita)
Economy > Public and publicly guaranteed debt service > TDS, current US$ (per $ GDP)
Economy > Public and publicly guaranteed (PPG) debt > DOD, current US$
Economy > Public and publicly guaranteed (PPG) debt > DOD, current US$ (per capita)
Economy > Public credit registry coverage > % of adults
Economy > Quasi-liquid liabilities > % of GDP
Economy > Real interest rate > %
Economy > Research and development expenditure > % of GDP
Economy > Researchers in R&D > per million people
Economy > Revenue, excluding grants > % of GDP
Economy > Royalty and license fees, payments > BoP, current US$
Economy > Royalty and license fees, payments > BoP, current US$ (per capita)
Economy > Royalty and license fees, payments > BoP, current US$ (per $ GDP)
Economy > Services, etc., value added > annual % growth
Economy > Services, etc., value added > constant 2000 US$
Economy > Services, etc., value added > constant 2000 US$ (per capita)
Economy > Services, etc., value added > current US$
Economy > Services, etc., value added > current US$ (per capita)
Economy > Services, etc., value added > current US$ (per $ GDP)
Economy > Service exports > BoP, current US$
Economy > Service exports > BoP, current US$ (per capita)
Economy > Service exports > BoP, current US$ (per $ GDP)
Economy > Service imports > BoP, current US$
Economy > Service imports > BoP, current US$ (per capita)
Economy > Service imports > BoP, current US$ (per $ GDP)
Economy > Short-term debt > % of total external debt
Economy > Subsidies and other transfers > % of expense
Economy > Total debt service > % of exports of goods, services and income
Economy > Total debt service > % of GNI
Economy > Total debt service > TDS, current US$
Economy > Total debt service > TDS, current US$ (per capita)
Economy > Total debt service > TDS, current US$ (per $ GDP)
Economy > Total reserves in months of imports
Economy > Total reserves > includes gold, current US$
Economy > Total reserves > includes gold, current US$ (per capita)
Economy > Total reserves > includes gold, current US$ (per $ GDP)
Economy > Total reserves minus gold > current US$
Economy > Total reserves minus gold > current US$ (per capita)
Economy > Total reserves minus gold > current US$ (per $ GDP)
Economy > Trade in services > % of GDP
Economy > Trade > % of GDP
Economy > Trade with US > US imports of railway transportation equipment
Education > Adjusted savings: education expenditure > % of GNI
Education > Children out of school, primary
Education > Children out of school, primary, female
Education > Children out of school, primary, female (per capita)
Education > Children out of school, primary, male
Education > Children out of school, primary, male (per capita)
Education > Children out of school, primary (per capita)
Education > Education spending (% Secondary)
Education > Expenditure per student, primary > % of GDP per capita
Education > Expenditure per student, secondary > % of GDP per capita
Education > Literacy rate, adult female > % of females ages 15 and above
Education > Literacy rate, adult male > % of males ages 15 and above
Education > Literacy rate, adult total > % of people ages 15 and above
Education > Literacy rate, youth female > % of females ages 15-24
Education > Literacy rate, youth male > % of males ages 15-24
Education > Literacy rate, youth total > % of people ages 15-24
Education > Net intake rate in grade 1, female > % of official school-age population
Education > Net intake rate in grade 1, male > % of official school-age population
Education > Net intake rate in grade 1 > % of official school-age population
Education > Persistence to grade 5, female > % of cohort
Education > Persistence to grade 5, male > % of cohort
Education > Persistence to grade 5, total > % of cohort
Education > Primary completion rate, female > % of relevant age group
Education > Primary completion rate, male > % of relevant age group
Education > Primary completion rate, total > % of relevant age group
Education > Primary education, duration > years
Education > Primary education, pupils
Education > Primary education, pupils > % female
Education > Primary education, pupils (per capita)
Education > Primary education, teachers
Education > Primary education, teachers > % female
Education > Primary education, teachers (per capita)
Education > Progression to secondary school > %
Education > Progression to secondary school, female > %
Education > Public spending on education, total > % of GDP
Education > Public spending on education, total > % of government expenditure
Education > Pupil-teacher ratio, primary
Education > Ratio of female to male enrollments in tertiary education
Education > Ratio of female to male primary enrollment
Education > Ratio of girls to boys in primary and secondary education > %
Education > Repetition rate, primary, female > % of total enrollment
Education > Repetition rate, primary, male > % of total enrollment
Education > Repetition rate, primary > % of total enrollment
Education > School enrollment, preprimary, female > % gross
Education > School enrollment, preprimary > % gross
Education > School enrollment, preprimary, male > % gross
Education > School enrollment, primary, female > % gross
Education > School enrollment, primary, female > % net
Education > School enrollment, primary > % gross
Education > School enrollment, primary, male > % gross
Education > School enrollment, primary, male > % net
Education > School enrollment, primary > % net
Education > School enrollment, primary, private > % of total primary
Education > School enrollment, secondary, female > % gross
Education > School enrollment, secondary, female > % net
Education > School enrollment, secondary > % gross
Education > School enrollment, secondary, male > % gross
Education > School enrollment, secondary, male > % net
Education > School enrollment, secondary > % net
Education > School enrollment, secondary, private > % of total secondary
Education > School enrollment, tertiary, female > % gross
Education > School enrollment, tertiary > % gross
Education > School enrollment, tertiary, male > % gross
Education > Scientific and technical journal articles
Education > Secondary education, general pupils
Education > Secondary education, general pupils (per capita)
Education > Secondary education, pupils
Education > Secondary education, pupils (per capita)
Education > Secondary education, teachers
Education > Secondary education, teachers > % female
Education > Secondary education, teachers (per capita)
Education > Secondary education, vocational pupils
Education > Secondary education, vocational pupils (per capita)
Education > Trained teachers in primary education, female > % of female teachers
Education > Trained teachers in primary education, male > % of male teachers
Education > Trained teachers in primary education > % of total teachers
Education > Unemployment with secondary education > % of total unemployment
Energy > Aviation Gasoline > Statistical differences (per capita)
Energy > Charcoal > Consumption by industry & construction
Energy > Charcoal > Consumption by other industries and construction
Energy > Charcoal > Consumption by other industries and construction (per capita)
Energy > Combustible renewables and waste > metric tones of oil equivalent
Energy > Electricity > % of managers surveyed ranking this as a major business constraint
Energy > Electrical outages > days
Energy > Electric power consumption > kWh
Energy > Electric power consumption > kWh (per capita)
Energy > Electric power transmission and distribution losses > million kWh
Energy > Electric power transmission and distribution losses > million kWh (per capita)
Energy > Electricity production from hydroelectric sources > kwh
Energy > Electricity production from hydroelectric sources > kwh (per capita)
Energy > Electricity production from hydroelectric sources > % of total
Energy > Electricity production from oil sources > kwh
Energy > Electricity production > kWh
Energy > Electricity production > kWh (per capita)
Energy > Fuel exports > % of merchandise exports
Energy > imports > kt of oil equivalent
Energy > imports > kt of oil equivalent (per capita)
Energy > imports, net > % of energy use
Energy > Investment in energy with private participation > current US$ (per capita)
Energy > Oil Consumption Test (per capita)
Energy > Oil Consumption Test (per $ GDP)
Energy > Oil Consumption Test Test (per capita)
Energy > Oil Consumption Test Test (per $ GDP)
Energy > production > kt of oil equivalent
Energy > production > kt of oil equivalent (per capita)
Energy > use > kt of oil equivalent
Energy > use > kt of oil equivalent (per capita)
Environment > Adjusted savings: carbon dioxide damage > % of GNI
Environment > Adjusted savings: particulate emission damage > % of GNI
Environment > CO2 emissions > kg per 2000 PPP $ of GDP
Environment > CO2 emissions > kt
Environment > CO2 emissions > kt (per capita)
Environment > CPIA policy and institutions for environmental sustainability rating
Environment > Forest area > % of land area
Environment > Forest area > sq. km
Environment > Forest area > sq. km (per capita)
Environment > Organic water pollutant (BOD) emissions > kg per day
Environment > PM10, country level > micrograms per cubic meter
Environment > Water pollution, chemical industry > % of total BOD emissions
Environment > Water pollution, clay and glass industry > % of total BOD emissions
Environment > Water pollution, metal industry > % of total BOD emissions
Environment > Water pollution, other industry > % of total BOD emissions
Environment > Water pollution, paper and pulp industry > % of total BOD emissions
Environment > Water pollution, textile industry > % of total BOD emissions
Environment > Water pollution, wood industry > % of total BOD emissions
Geography > Land area > sq. km
Geography > Land area > sq. km (per capita)
Geography > Population density > people per sq. km
Geography > Rural population density > rural population per sq. km of arable land
Geography > Surface area > sq. km
Geography > Surface area > sq. km (per capita)
Government > CPIA equity of public resource use rating
Government > CPIA quality of public administration rating
Government > General government final consumption expenditure > annual % growth
Government > General government final consumption expenditure > constant 2000 US$
Government > General government final consumption expenditure > constant 2000 US$ (per capita)
Government > General government final consumption expenditure > current US$
Government > General government final consumption expenditure > current US$ (per capita)
Government > General government final consumption expenditure > current US$ (per $ GDP)
Government > Proportion of seats held by women in national parliament > %
Government > Procedures to build a warehouse > number
Government > Procedures to build a warehouse > number (per capita)
Government > Procedures to enforce a contract > number
Government > Procedures to enforce a contract > number (per capita)
Government > Procedures to register property > number
Government > Procedures to register property > number (per capita)
Government > Start-up procedures to register a business > number
Government > Start-up procedures to register a business > number (per capita)
Government > Time required to build a warehouse > days
Government > Time required to enforce a contract > days
Government > Time required to register property > days
Government > Time required to start a business > days
Government > Time to prepare and pay taxes > hours
Government > Time to resolve insolvency > years
Government > Trademarks, nonresidents
Government > Trademarks, nonresidents (per capita)
Government > Trademarks, residents
Government > Trademarks, residents (per capita)
Health > Adolescent fertility rate > births per 1,000 women ages 15-19
Health > Birth rate, crude > per 1,000 people
Health > expenditure per capita > current US$
Health > expenditure, private > % of GDP
Health > expenditure, public > % of GDP
Health > expenditure, total > % of GDP
Health > External resources for health > % of total expenditure on health
Health > Female adults with HIV > % of population ages 15+ with HIV
Health > Fertility rate, total > births per woman
Health > Hospital beds > per 1,000 people
Health > Immunization, DPT > % of children ages 12-23 months
Health > Immunization, measles > % of children ages 12-23 months
Health > Improved sanitation facilities > % of population with access
Health > Improved sanitation facilities, rural > % of rural population with access
Health > Improved sanitation facilities, urban > % of urban population with access
Health > Improved water source > % of population with access
Health > Improved water source, rural > % of rural population with access
Health > Improved water source, urban > % of urban population with access
Health > Incidence of tuberculosis > per 100,000 people
Health > Life expectancy at birth, female > years
Health > Life expectancy at birth, male > years
Health > Life expectancy at birth, total > years
Health > Out-of-pocket health expenditure > % of private expenditure on health
Health > Physicians > per 1,000 people
Health > Prevalence of HIV, total > % of population ages 15-49
Health > Prevalence of undernourishment > % of population
Health > Smoking prevalence, females > % of adults
Health > Tuberculosis cases detected under DOTS > %
Health > Tuberculosis treatment success rate > % of registered cases
Immigration > International migration stock > % of population
Immigration > International migration stock, total
Immigration > Net migration
Immigration > Net migration (per capita)
Immigration > Refugee population by country or territory of asylum
Immigration > Refugee population by country or territory of asylum (per capita)
Immigration > Refugee population by country or territory of origin
Immigration > Refugee population by country or territory of origin (per capita)
Industry > Adjusted savings: mineral depletion > % of GNI
Industry > Changes in inventories > current US$
Industry > Changes in inventories > current US$ (per capita)
Industry > Changes in inventories > current US$ (per $ GDP)
Industry > Machinery and transport equipment > % of value added in manufacturing
Industry > Manufactures exports > % of merchandise exports
Industry > Manufactures imports > % of merchandise imports
Industry > Manufacturing, value added > annual % growth
Industry > Manufacturing, value added > constant 2000 US$
Industry > Manufacturing, value added > constant 2000 US$ (per capita)
Industry > Manufacturing, value added > current US$
Industry > Manufacturing, value added > current US$ (per capita)
Industry > Ores and metals exports > % of merchandise exports
Industry > Ores and metals imports > % of merchandise imports
Industry > Patent applications, nonresidents
Industry > Patent applications, nonresidents (per capita)
Industry > Patent applications, residents
Industry > Patent applications, residents (per capita)
Industry > Textiles and clothing > % of value added in manufacturing
Industry > value added > annual % growth
Industry > value added > constant 2000 US$
Industry > value added > constant 2000 US$ (per capita)
Industry > value added > current US$
Industry > value added > current US$ (per capita)
Industry > value added > current US$ (per $ GDP)
Internet > Broadband subscribers
Internet > Broadband subscribers (per capita)
Internet > International Internet bandwidth > Mbps
Internet > International Internet bandwidth > Mbps (per capita)
Internet > International Internet bandwidth > Mbps (per $ GDP)
Internet > Price basket for Internet > US$ per month
Internet > Secure Internet servers
Internet > Secure Internet servers (per capita)
Labor > Child employment in agriculture, female > % of female economically active children ages 7-14
Labor > Child employment in agriculture > % of economically active children ages 7-14
Labor > Compensation of employees > % of expense
Labor > CPIA building human resources rating
Labor > Economically active children, female
Labor > Economically active children, study and work
Labor > Economically active children, total
Labor > Economically active children, work only, female
Labor > Employees, agriculture, female > % of female employment
Labor > Employment in industry > % of total employment
Labor > Employment in services > % of total employment
Labor > Employees, industry, female > % of female employment
Labor > Employees, industry, male > % of male employment
Labor > Employees, services, female > % of female employment
Labor > Employees, services, male > % of male employment
Labor > Firing cost > weeks of wages
Labor > force, female > % of total labor force
Labor > force participation rate, female > % of female population ages 15-64
Labor > force participation rate, male > % of male population ages 15-64
Labor > force participation rate, total > % of total population ages 15-64
Labor > force, total
Labor > force, total (per capita)
Labor > force with secondary education > % of total
Labor > force with tertiary education > % of total
Labor > regulations > % of managers surveyed ranking this as a major business constraint
Labor > Rigidity of employment index
Labor > Share of women employed in the nonagricultural sector > % of total nonagricultural employment
Labor > skills > % of managers surveyed ranking this as a major business constraint
Labor > Unemployment, female > % of female labor force
Labor > Unemployment, male > % of male labor force
Labor > Unemployment, total > % of total labor force
Labor > Unemployment with secondary education, female > % of female unemployment
Labor > Unemployment with secondary education, male > % of male unemployment
Labor > Unemployment with tertiary education, male > % of male unemployment
Labor > Unemployment, youth female > % of female labor force ages 15-24
Labor > Unemployment, youth male > % of male labor force ages 15-24
Labor > Unemployment, youth total > % of total labor force ages 15-24
Labor > Workers' remittances and compensation of employees, paid > US$
Labor > Workers' remittances and compensation of employees, paid > US$ (per capita)
Labor > Workers' remittances and compensation of employees, paid > US$ (per $ GDP)
Labor > Workers' remittances and compensation of employees, received > US$
Labor > Workers' remittances and compensation of employees, received > US$ (per capita)
Labor > Workers' remittances, receipts > BoP, current US$
Media > Computer, communications and other services > % of commercial service exports
Media > Computer, communications and other services > % of commercial service imports
Media > Fixed line and mobile phone subscribers > per 1,000 people
Media > Households with television > %
Media > International voice traffic > out and in, minutes
Media > International voice traffic > out and in, minutes (per capita)
Media > Investment in telecoms with private participation > current US$
Media > Investment in telecoms with private participation > current US$ (per capita)
Media > Investment in telecoms with private participation > current US$ (per $ GDP)
Media > Mobile phone subscribers
Media > Mobile phone subscribers (per capita)
Media > Personal computers
Media > Personal computers (per capita)
Media > Population covered by mobile telephony > %
Media > Price basket for mobile > US$ per month
Media > Price basket for residential fixed line > US$ per month
Media > Telephone average cost of call to US > US$ per three minutes
Media > Telephone average cost of call to US > US$ per three minutes (per capita)
Media > Telephone average cost of call to US > US$ per three minutes (per $ GDP)
Media > Telephone employees, total
Media > Telephone employees, total (per capita)
Media > Telephone faults > per 100 mainlines
Media > Telecommunications investment > % of revenue
Media > Telephone mainlines
Media > Telephone mainlines (per capita)
Media > Telecommunications revenue > % GDP
Media > Telephone subscribers
Media > Telephone subscribers per employee
Media > Telephone subscribers (per capita)
Military > Arms exports > constant 1990 US$
Military > Arms exports > constant 1990 US$ (per capita)
Military > Arms imports > constant 1990 US$
Military > Arms imports > constant 1990 US$ (per capita)
Military > expenditure > % of central government expenditure
Military > expenditure > % of GDP
Military > personnel
Military > personnel > % of total labor force
Military > personnel (per capita)
Military > Tanks
People > Age dependency ratio > dependents to working-age population
People > Asian Latin American population > Composition > Chinese
People > CPIA social protection rating
People > Population ages 0-14 > % of total
People > Population ages 15-64 > % of total
People > Population ages 65 and above > % of total
People > Population, female > % of total
People > Population growth > annual %
People > Population in largest city
People > Population in largest city (per capita)
People > Population in the largest city > % of urban population
People > Population in urban agglomerations > more than 1 million
People > Population in urban agglomerations > more than 1 million (per capita)
People > Rural population
People > Rural population growth > annual %
People > Rural population (per capita)
People > Urban population
People > Urban population growth > annual %
People > Urban population (per capita)
Taxation > Average time to clear customs > days
Taxation > CPIA fiscal policy rating
Taxation > Customs and other import duties > % of tax revenue
Taxation > Highest marginal tax rate, corporate rate > %
Taxation > Highest marginal tax rate, individual > on income exceeding, US$
Taxation > Highest marginal tax rate, individual rate > %
Taxation > Net taxes on products > current US$
Taxation > Net taxes on products > current US$ (per capita)
Taxation > Other taxes > % of revenue
Taxation > Social contributions > % of revenue
Taxation > Taxes on exports > % of tax revenue
Taxation > Taxes on goods and services > % value added of industry and services
Taxation > Taxes on income, profits and capital gains > % of revenue
Taxation > Taxes on income, profits and capital gains > % of total taxes
Taxation > Taxes on international trade > % of revenue
Taxation > Tax payments > number
Taxation > Tax payments > number (per capita)
Taxation > Tax rates > % of managers surveyed ranking this as a major business constraint
Taxation > Tax revenue > % of GDP
Taxation > Total tax rate > % of profit
Transportation > Air transport, freight > million tons per km
Transportation > Air transport, passengers carried
Transportation > Air transport, passengers carried (per capita)
Transportation > Air transport, registered carrier departures worldwide
Transportation > Air transport, registered carrier departures worldwide (per capita)
Transportation > Rail lines > total route-km
Transportation > Roads, paved > % of total roads
Transportation > Roads, total network > km
Transportation > Travel services > % of commercial service imports
2nd last
Agriculture > Exports to USA > Leguminous vegetables (per capita)
Agriculture > Exports to USA > Strawberries (per capita)
Crime > Corruption > % of managers surveyed ranking this as a major business constraint
Crime > Courts > % of managers surveyed lacking confidence in courts to uphold property rights
Economy > Claims on private sector > annual growth as % of M2
Economy > Finance > % of managers surveyed ranking this as a major business constraint
Economy > Inflation, GDP deflator > annual %
Economy > Net financial flows, IMF concessional > current US$
Economy > Trade with US > US imports of coal and related fuels
Economy > Trade with US > US imports of computers
Economy > Trade with US > US imports of generators, transformers, and accessories
Education > Ratio of young literate females to males > % ages 15-24
Energy > Aviation Gasoline > Changes in stocks (per capita)
Energy > Charcoal > Consumption by industry & construction (per capita)
Energy > Electricity > Consumption by pump-storage plants
Energy > Fuelwood > Consumption in agriculture
Energy > Gas-diesel oils > Conversion in other energy-producing plants
Energy > Gas-diesel oils > Exports (per capita)
Energy > Other Petroleum Products > Consumption by industry & construction
Energy > Other Petroleum Products > Consumption by other industries and construction
Energy > Other Petroleum Products > Net inland availability
Government > Management time dealing with officials > % of management time
Government > Policy uncertainty > % of managers surveyed ranking this as a major business constraint
Labor > Child employment in agriculture, male > % of male economically active children ages 7-14
Labor > Economically active children, male
Labor > Economically active children, study and work, male
Media > Cinemas
Media > Cinemas > Seats
Media > Cinemas > Seats (per capita)
People > Education expenditures
Transportation > Railways > Total
Transportation > Railways > Total (per capita)
Transportation > Railways > Total (per $ GDP)
3rd last
Agriculture > Exports to USA > Black red or white currants and gooseberries (per capita)
Agriculture > Exports to USA > Raspberries blackberries mulberries and loganberries
Agriculture > Exports to USA > Strawberries
Agriculture > Exports to USA > Urd mung black or green gram beans (per capita)
Economy > Net financial flows, IMF concessional > current US$ (per $ GDP)
Economy > Trade with US > US exports of gem diamonds
Economy > Trade with US > US imports of agricultural machinery and equipment
Economy > Trade with US > US imports of other petroleum products
Economy > Trade with US > US imports of pulp and paper machinery
Energy > Aviation Gasoline > Changes in stocks
Energy > Bitumen Asphalt > Net inland availability (per capita)
Energy > Gas-diesel oils > Exports
Energy > Liquefied Petroleum Gas > Consumption by petroleum refineries
Energy > Lubricants > Net inland availability (per capita)
Energy > Motor Gasoline > Consumption in agriculture
Energy > Other Petroleum Products > Imports
Energy > Vegetal Waste > Consumption by industry & construction
Energy > Vegetal Waste > Consumption by industry & construction (per capita)
Energy > Vegetal Waste > Consumption by other industries and construction
Energy > Vegetal Waste > Consumption by other industries and construction (per capita)
Energy > Vegetal Waste > Energy balance requirement
Energy > Vegetal Waste > Gross inland availability
Energy > Vegetal Waste > Net inland availability
Energy > Vegetal Waste > Production
Environment > Environmental agreement compliance
Health > Births attended by skilled health staff > % of total
Labor > Child employment in manufacturing, male > % of male economically active children ages 7-14
Labor > Unemployment with tertiary education > % of total unemployment
Media > Cinemas (per capita)
Sports > Honduras national football team > Records versus other nations > Drawn
Transportation > Airports > With unpaved runways > 1524 to 2437 m
Transportation > Pipelines > Total length
4th last
Agriculture > Exports to USA > Raspberries blackberries mulberries and loganberries (per capita)
Agriculture > Exports to USA > Tamarinds
Agriculture > Exports to USA > Tamarinds (per capita)
Crime > Courts > % of managers surveyed ranking this as a major business constraint
Economy > Consumer price index
Economy > Net current transfers from abroad > current US$
Economy > Portfolio investment, bonds > PPG + PNG > NFL, current US$
Economy > Trade with US > US exports of cotton, raw
Economy > Trade with US > US exports of natural gas liquids
Economy > Trade with US > US exports of precious metals, other
Economy > Trade with US > US imports of cocoa beans
Economy > Trade with US > US imports of leather and furs-unmanufactured
Economy > Trade with US > US imports of parts for civilian aircraft
Education > Gross intake rate in grade 1, female > % of relevant age group
Education > Gross intake rate in grade 1, male > % of relevant age group
Education > Gross intake rate in grade 1, total > % of relevant age group
Education > Ratio of female to male secondary enrollment
Education > Secondary education, pupils > % female
Energy > Electricity > Exports
Energy > Investment in energy with private participation > current US$
Energy > Liquefied Petroleum Gas > Consumption by energy sector
Energy > Liquefied Petroleum Gas > Consumption in agriculture
Energy > Other Petroleum Products > Net inland availability (per capita)
Energy > Residual Fuel Oil > Consumption in agriculture
Energy > Vegetal Waste > Energy balance requirement (per capita)
Energy > Vegetal Waste > Gross inland availability (per capita)
Energy > Vegetal Waste > Net inland availability (per capita)
Energy > Vegetal Waste > Production (per capita)
Labor > Economically active children, work only
Labor > Economically active children, work only, male
Transportation > Investment in transport with private participation > current US$
5th last
Agriculture > Banana production
Agriculture > Exports to USA > Black red or white currants and gooseberries
Agriculture > Exports to USA > Leguminous vegetables
Agriculture > Exports to USA > Urd mung black or green gram beans
Economy > Trade with US > US exports of vessels, excluding scrap
Economy > Trade with US > US imports of jewelry watches, rings, etc
Education > Literacy rates, aged 15-24 > Men
Education > School life expectancy > Primary to tertiary > Female
Energy > Aviation Gasoline > Changes in stocks at importers
Energy > Aviation Gasoline > Changes in stocks at importers (per capita)
Energy > Fuelwood > Consumption by industry & construction
Energy > Fuelwood > Consumption by other industries and construction
Energy > Gas-diesel oils > Conversion in other energy-producing plants (per capita)
Energy > Investment in energy with private participation > current US$ (per $ GDP)
Energy > Lubricants > Net inland availability
Energy > Residual Fuel Oil > Consumption by petroleum refineries
Energy > White spirit/industrial spirit > Consumption for non-energy uses
Environment > Acidification
Labor > Child employment in manufacturing > % of economically active children ages 7-14
Taxation > Taxes on goods and services > % of revenue
Transportation > Pipelines > Total length (per capita)
6th last
Agriculture > Exports to USA > Asparagus (per capita)
Agriculture > Exports to USA > Fruits (per capita)
Economy > Income distribution > Poorest 10%
Economy > Innovation
Economy > Trade with US > US imports of numismatic coins
Education > School life expectancy > Primary to tertiary
Education > School life expectancy > Primary to tertiary > Male
Energy > Bitumen Asphalt > Changes in stocks (per capita)
Energy > Charcoal > Consumption by households
Energy > Charcoal > Consumption by households (per capita)
Energy > Electricity > Geothermal > Production
Energy > Electricity > Geothermal > Production > Public
Energy > Kerosene > Exports
Energy > Other Petroleum Products > Consumption by industry & construction (per capita)
Energy > Other Petroleum Products > Consumption by other industries and construction (per capita)
Energy > White spirit/industrial spirit > Energy balance requirement (per capita)
Labor > Child employment in services, male > % of male economically active children ages 7-14
Labor > Child employment in services > % of economically active children ages 7-14
Labor > Economically active children, study and work, female
Military > Armed forces growth
People > Afro-Latin American > IDB population estimates > % Black Lower
Transportation > Highways > Paved (per capita)
Transportation > Roadways > Paved
Related links:
Save this page on
del.icio.us
/
furl
/
your bookmarks
More facts and figures on
Nicaragua
Agriculture
(120)
Background
(3)
Crime
(18)
Currency
(10)
Disasters
(1)
Democracy
(32)
Economy
(1154)
Education
(155)
Environment
(71)
Energy
(336)
Food
(5)
Geography
(46)
Government
(85)
Health
(124)
Internet
(21)
Immigration
(19)
Industry
(34)
Identification
(19)
Language
(7)
Labor
(117)
Military
(47)
Media
(71)
Mortality
(1593)
People
(235)
Religion
(31)
Sports
(19)
Terrorism
(22)
Taxation
(32)
Transportation
(84)
COMMENTARY
Post Reply
Share your thoughts, questions and commentary here
Your name
Your comments
Please enter the 5-letter protection code
Want to know more?
Search encyclopedia, statistics and forums:
Lesson Plans
|
Student Area
|
Student FAQ
|
Reviews
|
Press Releases
|
Feeds
|
Contact
©
Copyright
NationMaster.com 2003-2009. All Rights Reserved. Usage implies agreement with
terms
.