
Facts and stats about Togo
Author: jaacosta47
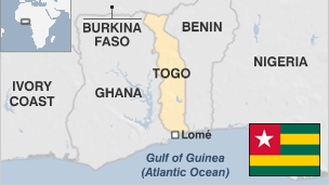
Togo or the Togolese Republic is a small country in West Africa with a population of about 6.7 million. The sub-Saharan country depends primarily on agriculture for revenue. Togo is a member of several international organisations such as the United Nations, African Union, Organisation of Islamic Cooperation, South Atlantic Peace and Cooperation Zone, and the Economic Community of West African States. Right now, the people of Togo have to contend with issues such as poverty, diseases lack of education, and economic deprivation. The United States is one of the developed nations that extend assistance to Togo while monitoring closely the government's willingness to work toward democratic goals. The United States Agency for International Development (USAID) implements local development programs through nongovernmental organizations in Togo. The country has a market-oriented economy and is entitled to special trade benefits under the African Growth and Opportunity Act. U.S. exports commodities such as fuel oil, motor vehicles, petroleum products machinery and food items to this African Republic. It has an existing trade surplus with Togo. On the other hand, the US imports cocoa and coffee from Togo. The country’s export processing zone was created with the support of the American government. It was able to entice private investors from the manufacturing, pharmaceuticals, cosmetics, and food processing sectors. Togo is a potential tourism destination. It possesses natural and cultural attractions as well as human hospitality that can make the country a tourism product. Thus, it can attract the large markets of the US, North America and Europe. Togo is among the most beautiful places in Western Africa. The roads are good and pristine white beaches can be found near the capital city of Lome.
54,390 sq km
Sq. km. Ranked 119th in 2008.