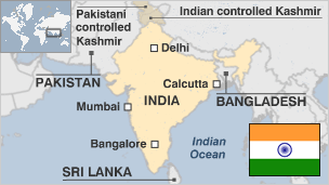
FACTOID #
119:
The United States
has the world's highest number of
McDonald’s restaurants per capita
. Americans also
die of obesity
more often than any other nation, with more deaths than
Mexico
,
Germany
,
Spain
,
Austria
and
Canada
combined.
Interesting food facts
»
Home
Encyclopedia
Statistics
Countries A-Z
Flags
Maps
Education
Forum
FAQ
About
WHAT'S NEW
Announcing TheFullWiki
Feature update
CIA update and time
»
December update
Hiring: Full time web
»
FACTS & STATISTICS
Simple view
Select countries to view:
(hold down Control key and click to select several)
Compare:
All
Top 5
Top 10
Top 20
Top 50
Top 100
Bottom 100
Bottom 20
Bottom 10
Bottom 5
All (desc)
Select fact or statistic:
(* = graphable)
Select Category
Agriculture
Background
Crime
Currency
Democracy
Disasters
Economy
Education
Energy
Environment
Food
Geography
Government
Health
Identification
Immigration
Industry
Internet
Labor
Language
Lifestyle
Media
Military
Mortality
People
Religion
Sports
Taxation
Terrorism
Transportation
(OPTIONAL) Compare to statistic:
(both need to be graphable)
Select Category
Agriculture
Background
Crime
Currency
Democracy
Disasters
Economy
Education
Energy
Environment
Food
Geography
Government
Health
Identification
Immigration
Industry
Internet
Labor
Language
Lifestyle
Media
Military
Mortality
People
Religion
Sports
Taxation
Terrorism
Transportation
View result as:
Map & graph / table
Correlations
Pie chart
Scatterplot with ...
Flags
Circles (same size)
Circles (size by population)
Circles (size by GDP)
Circles (size by land area)
(OR) SEARCH ALL
encyclopedia, stats & forums:
Asia
>
India
> Bottom Rankings
View full size
VIEW STATS:
Popular
All stats
Last
Agriculture > Agricultural land > sq. km (per capita)
Agriculture > Agricultural machinery > tractors per 100 hectares of arable land
Agriculture > Agricultural machinery > tractors (per capita)
Agriculture > Agricultural raw materials exports > % of merchandise exports
Agriculture > Agriculture, value added > constant 2000 US$ (per capita)
Agriculture > Agriculture, value added > current US$ (per capita)
Agriculture > Agriculture, value added > current US$ (per $ GDP)
Agriculture > Cereal yield > kg per hectare
Agriculture > Crop production index
Agriculture > Fertilizer consumption > 100 grams per hectare of arable land
Agriculture > Fertilizer consumption > metric tons (per capita)
Agriculture > Food production index
Agriculture > Grains > Coarse grain consumption (per capita)
Agriculture > Grains > Corn consumption (per capita)
Agriculture > Grains > Corn production (per capita)
Agriculture > Grains > Wheat exports (per capita)
Agriculture > Grains > Wheat imports (per capita)
Agriculture > Land under cereal production > hectares (per capita)
Agriculture > Livestock production index
Agriculture > Production > Barley (per capita)
Agriculture > Production > Corn (per capita)
Agriculture > value added > constant 2000 US$ (per capita)
Agriculture > value added > current US$ (per capita)
Agriculture > value added > current US$ (per $ GDP)
Agriculture > value added per worker > constant 2000 US$
Crime > Courts > % of managers surveyed lacking confidence in courts to uphold property rights
Crime > > % of managers surveyed ranking this as a major business constraint
Currency > PPP conversion factor to official exchange rate ratio
Currency > S&P/EMDB indexes > annual % change
Democracy > CPIA gender equality rating
Democracy > CPIA policies for social inclusion/equity cluster average
Democracy > CPIA property rights and rule-based governance rating
Democracy > CPIA public sector management and institutions cluster average
Democracy > CPIA transparency, accountability, and corruption in the public sector rating
Economy > Adjusted savings: consumption of fixed capital > % of GNI
Economy > Aid > % of central government expenditures
Economy > Aid > % of GNI
Economy > Aid > % of gross capital formation
Economy > Aid > % of imports of goods and services
Economy > Aid per capita > current US$
Economy > Bank and trade-related lending > PPG + PNG > NFL, current US$ (per capita)
Economy > Bank capital to assets ratio > %
Economy > Bank nonperfoming loans to total gross loans > %
Economy > Business disclosure index
Economy > Cash surplus/deficit > % of GDP
Economy > Central government debt, total > % of GDP
Economy > Certified ISO companies (per capita)
Economy > Changes in net reserves > BoP, current US$
Economy > Changes in net reserves > BoP, current US$ (per capita)
Economy > Changes in net reserves > BoP, current US$ (per $ GDP)
Economy > Claims on governments, etc. > annual growth as % of M2
Economy > Claims on private sector > annual growth as % of M2
Economy > Commercial service exports > current US$ (per capita)
Economy > Commercial service exports > current US$ (per $ GDP)
Economy > Commercial service imports > current US$ (per capita)
Economy > Commercial service imports > current US$ (per $ GDP)
Economy > Consumer price index
Economy > Cost of business start-up procedures > % of GNI per capita
Economy > CPIA business regulatory environment rating
Economy > CPIA debt policy rating
Economy > CPIA economic management cluster average
Economy > CPIA efficiency of revenue mobilization rating
Economy > CPIA financial sector rating
Economy > CPIA macroeconomic management rating
Economy > CPIA quality of budgetary and financial management rating
Economy > CPIA structural policies cluster average
Economy > CPIA trade rating
Economy > Credit information availability index
Economy > Current account balance > BoP, current US$ (per capita)
Economy > Current account balance > BoP, current US$ (per $ GDP)
Economy > Current account balance > % of GDP
Economy > Current transfers, receipts > BoP, current US$ (per capita)
Economy > Current transfers, receipts > BoP, current US$ (per $ GDP)
Economy > Domestic credit provided by banking sector > % of GDP
Economy > Domestic credit to private sector > % of GDP
Economy > Ease of doing business index
Economy > Economic importance
Economy > Entrepreneurship > Starting a Business > Min. Capital (% GNI per capita)
Economy > Exports > Canadian pulp, paper and paperboard exports > 1998
Economy > Exports > Canadian pulp, paper and paperboard exports > 1999
Economy > Exports > Canadian pulp, paper and paperboard exports > 2000
Economy > Exports > Canadian pulp, paper and paperboard exports > 2001
Economy > Exports > Canadian pulp, paper and paperboard exports > 2002
Economy > Exports > Commercial services (per capita)
Economy > Exports > Merchandise (per $ GDP)
Economy > Expense > % of GDP
Economy > Exports of goods and services > BoP, current US$ (per capita)
Economy > Exports of goods and services > BoP, current US$ (per $ GDP)
Economy > Exports of goods and services > constant 2000 US$ (per capita)
Economy > Exports of goods and services > current US$ (per capita)
Economy > Exports of goods and services > current US$ (per $ GDP)
Economy > Exports of goods and services > % of GDP
Economy > Exports of goods, services and income > BoP, current US$ (per capita)
Economy > Exports of goods, services and income > BoP, current US$ (per $ GDP)
Economy > Export value index
Economy > External balance on goods and services > current US$
Economy > External balance on goods and services > current US$ (per capita)
Economy > External balance on goods and services > current US$ (per $ GDP)
Economy > External balance on goods and services > % of GDP
Economy > External debt, total > DOD, current US$ (per capita)
Economy > External debt, total > DOD, current US$ (per $ GDP)
Economy > Final consumption expenditure > constant 2000 US$ (per capita)
Economy > Final consumption expenditure > current US$ (per capita)
Economy > Final consumption expenditure > current US$ (per $ GDP)
Economy > Final consumption expenditure, etc. > annual % growth
Economy > Final consumption expenditure, etc. > constant 2000 US$ (per capita)
Economy > Final consumption expenditure, etc. > current US$ (per capita)
Economy > Final consumption expenditure, etc. > current US$ (per $ GDP)
Economy > Final consumption expenditure, etc. > % of GDP
Economy > Financial information infrastructure index
Economy > Finance > % of managers surveyed ranking this as a major business constraint
Economy > Foreign direct investment, net > BoP, current US$ (per capita)
Economy > Foreign direct investment, net > BoP, current US$ (per $ GDP)
Economy > Foreign direct investment, net inflows > BoP, current US$ (per capita)
Economy > Foreign direct investment, net inflows > BoP, current US$ (per $ GDP)
Economy > Foreign direct investment, net inflows > % of GDP
Economy > Foreign direct investment, net outflows > % of GDP
Economy > GDP > constant 2000 US$ (per capita)
Economy > GDP deflator
Economy > GDP per capita > constant 2000 US$
Economy > GDP per capita, PPP > constant 2000 international $
Economy > GDP per capita, PPP > current international $
Economy > GDP per unit of energy use
Economy > GDP, PPP > constant 2000 international $ (per capita)
Economy > GDP, PPP > current international $ (per capita)
Economy > GNI, Atlas method > current US$ (per capita)
Economy > GNI, Atlas method > current US$ (per $ GDP)
Economy > GNI > current US$ (per capita)
Economy > GNI > current US$ (per $ GDP)
Economy > GNI, PPP > current international $ (per capita)
Economy > Goods and services expense > % of expense
Economy > Goods exports > BoP, current US$ (per capita)
Economy > Goods exports > BoP, current US$ (per $ GDP)
Economy > Goods imports > BoP, current US$ (per capita)
Economy > Goods imports > BoP, current US$ (per $ GDP)
Economy > Grants and other revenue > % of revenue
Economy > Gross capital formation > constant 2000 US$ (per capita)
Economy > Gross capital formation > current US$ (per capita)
Economy > Gross domestic savings > current US$ (per capita)
Economy > Gross fixed capital formation > constant 2000 US$ (per capita)
Economy > Gross fixed capital formation > current US$ (per capita)
Economy > Gross national expenditure > constant 2000 US$ (per capita)
Economy > Gross national expenditure > current US$ (per capita)
Economy > Gross national expenditure > current US$ (per $ GDP)
Economy > Gross private capital flows > % of GDP
Economy > Gross savings > current US$ (per capita)
Economy > Gross value added at factor cost > constant 2000 US$ (per capita)
Economy > Gross value added at factor cost > current US$ (per capita)
Economy > Gross value added at factor cost > current US$ (per $ GDP)
Economy > High-technology exports > current US$
Economy > High-technology exports > current US$ (per capita)
Economy > High-technology exports > current US$ (per $ GDP)
Economy > High-technology exports > % of manufactured exports
Economy > Household final consumption expenditure > constant 2000 US$ (per capita)
Economy > Household final consumption expenditure > current US$ (per capita)
Economy > Household final consumption expenditure > current US$ (per $ GDP)
Economy > Household final consumption expenditure, etc. > annual % growth
Economy > Household final consumption expenditure, etc. > constant 2000 US$ (per capita)
Economy > Household final consumption expenditure, etc. > current US$ (per capita)
Economy > Household final consumption expenditure, etc. > current US$ (per $ GDP)
Economy > Household final consumption expenditure, etc. > % of GDP
Economy > Household final consumption expenditure per capita > constant 2000 US$
Economy > IBRD loans and IDA credits > PPG DOD, current US$ (per capita)
Economy > IDA resource allocation index
Economy > Imports of goods and services > BoP, current US$ (per capita)
Economy > Imports of goods and services > BoP, current US$ (per $ GDP)
Economy > Imports of goods and services > constant 2000 US$ (per capita)
Economy > Imports of goods and services > current US$ (per capita)
Economy > Imports of goods and services > current US$ (per $ GDP)
Economy > Imports of goods, services and income > BoP, current US$ (per capita)
Economy > Imports of goods, services and income > BoP, current US$ (per $ GDP)
Economy > Import quantum/quantity index
Economy > Income payments > BoP, current US$ (per capita)
Economy > Income payments > BoP, current US$ (per $ GDP)
Economy > Income receipts > BoP, current US$ (per capita)
Economy > Income receipts > BoP, current US$ (per $ GDP)
Economy > Inflation, consumer prices > annual %
Economy > Inflation, GDP deflator > annual %
Economy > Insurance and financial services > % of commercial service exports
Economy > Insurance and financial services > % of commercial service imports
Economy > International tourism, expenditures > current US$
Economy > International tourism, expenditures > current US$ (per capita)
Economy > International tourism, expenditures > current US$ (per $ GDP)
Economy > International tourism, expenditures > % of total imports
Economy > International tourism, number of arrivals
Economy > International tourism, number of departures
Economy > International tourism, receipts > current US$
Economy > International tourism, receipts > current US$ (per capita)
Economy > International tourism, receipts > current US$ (per $ GDP)
Economy > International tourism, receipts > % of total exports
Economy > Legal rights of borrowers and lenders index
Economy > Lending interest rate > %
Economy > Liquid liabilities (M3) as % of GDP
Economy > Listed domestic companies (per capita)
Economy > Long-term debt > DOD, current US$ (per capita)
Economy > Long-term debt > DOD, current US$ (per $ GDP)
Economy > Market capitalization of listed companies > current US$ (per capita)
Economy > Market capitalization of listed companies > current US$ (per $ GDP)
Economy > Merchandise exports > current US$ (per capita)
Economy > Merchandise exports > current US$ (per $ GDP)
Economy > Merchandise imports > current US$ (per capita)
Economy > Merchandise imports > current US$ (per $ GDP)
Economy > Merchandise trade > % of GDP
Economy > Micro, small and medium enterprises > number (per capita)
Economy > Money and quasi money growth > annual %
Economy > Money and quasi money (M2) to total reserves ratio
Economy > Multilateral debt service > % of public and publicly guaranteed debt service
Economy > Net barter terms of trade
Economy > Net capital account > BoP, current US$ (per capita)
Economy > Net capital account > BoP, current US$ (per $ GDP)
Economy > Net current transfers > BoP, current US$ (per capita)
Economy > Net current transfers > BoP, current US$ (per $ GDP)
Economy > Net current transfers from abroad > current US$ (per capita)
Economy > Net current transfers from abroad > current US$ (per $ GDP)
Economy > Net errors and omissions, adjusted > BoP, current US$ (per capita)
Economy > Net errors and omissions, adjusted > BoP, current US$ (per $ GDP)
Economy > Net financial flows, IDA > current US$ (per capita)
Economy > Net financial flows, IDA > current US$ (per $ GDP)
Economy > Net financial flows, IMF concessional > current US$
Economy > Net financial flows, others > current US$
Economy > Net financial flows, others > current US$ (per capita)
Economy > Net financial flows, others > current US$ (per $ GDP)
Economy > Net income > BoP, current US$
Economy > Net income > BoP, current US$ (per capita)
Economy > Net income > BoP, current US$ (per $ GDP)
Economy > Net income from abroad > current US$
Economy > Net income from abroad > current US$ (per capita)
Economy > Net income from abroad > current US$ (per $ GDP)
Economy > Net incurrence of liabilities, foreign > % of GDP
Economy > Net trade in goods and services > BoP, current US$
Economy > Net trade in goods and services > BoP, current US$ (per capita)
Economy > Net trade in goods and services > BoP, current US$ (per $ GDP)
Economy > Net trade in goods > BoP, current US$
Economy > Net trade in goods > BoP, current US$ (per capita)
Economy > Net trade in goods > BoP, current US$ (per $ GDP)
Economy > Official development assistance and official aid > current US$ (per capita)
Economy > Official development assistance and official aid > current US$ (per $ GDP)
Economy > Other expense > % of expense
Economy > Portfolio investment, bonds > PPG + PNG > NFL, current US$
Economy > Portfolio investment, bonds > PPG + PNG > NFL, current US$ (per capita)
Economy > Portfolio investment, bonds > PPG + PNG > NFL, current US$ (per $ GDP)
Economy > Portfolio investment, excluding LCFAR > BoP, current US$
Economy > Portfolio investment, excluding LCFAR > BoP, current US$ (per capita)
Economy > Portfolio investment, excluding LCFAR > BoP, current US$ (per $ GDP)
Economy > Present value of debt > % of exports of goods and services
Economy > Present value of debt > % of GNI
Economy > Private credit bureau coverage > % of adults
Economy > Private nonguaranteed debt > DOD, current US$ (per capita)
Economy > Private nonguaranteed debt > DOD, current US$ (per $ GDP)
Economy > Public and publicly guaranteed debt service > % of GNI
Economy > Public and publicly guaranteed debt service > TDS, current US$ (per capita)
Economy > Public and publicly guaranteed debt service > TDS, current US$ (per $ GDP)
Economy > Public and publicly guaranteed (PPG) debt > DOD, current US$ (per capita)
Economy > Public and publicly guaranteed (PPG) debt > DOD, current US$ (per $ GDP)
Economy > Real interest rate > %
Economy > Research and development expenditure > % of GDP
Economy > Research and development personnel (per $ GDP)
Economy > Researchers in R&D > per million people
Economy > Revenue, excluding grants > % of GDP
Economy > Royalty and license fees, payments > BoP, current US$ (per capita)
Economy > Royalty and license fees, payments > BoP, current US$ (per $ GDP)
Economy > Royalty and license fees, receipts > BoP, current US$
Economy > Royalty and license fees, receipts > BoP, current US$ (per capita)
Economy > Royalty and license fees, receipts > BoP, current US$ (per $ GDP)
Economy > Services, etc., value added > constant 2000 US$ (per capita)
Economy > Services, etc., value added > current US$ (per capita)
Economy > Services, etc., value added > current US$ (per $ GDP)
Economy > Service exports > BoP, current US$ (per capita)
Economy > Service exports > BoP, current US$ (per $ GDP)
Economy > Service imports > BoP, current US$ (per capita)
Economy > Service imports > BoP, current US$ (per $ GDP)
Economy > Short-term debt > % of exports of goods, services and income
Economy > Short-term debt > % of total external debt
Economy > SPAR > SPAR International Statistics 2005 > Retail Store > Numbers
Economy > Stocks traded, total value > current US$ (per capita)
Economy > Stocks traded, total value > current US$ (per $ GDP)
Economy > Subsidies and other transfers > % of expense
Economy > Total debt service > % of GNI
Economy > Total debt service > TDS, current US$ (per capita)
Economy > Total debt service > TDS, current US$ (per $ GDP)
Economy > Total reserves > includes gold, current US$ (per capita)
Economy > Total reserves > includes gold, current US$ (per $ GDP)
Economy > Total reserves minus gold > current US$ (per capita)
Economy > Total reserves minus gold > current US$ (per $ GDP)
Economy > Transnational corporations > Parents (per capita)
Economy > Trade in services > % of GDP
Economy > Trade > % of GDP
Economy > Use of IMF credit > DOD, current US$
Economy > Use of IMF credit > DOD, current US$ (per capita)
Economy > Use of IMF credit > DOD, current US$ (per $ GDP)
Education > Adjusted savings: education expenditure > % of GNI
Education > Expenditure per student, primary > % of GDP per capita
Education > Expenditure per student, secondary > % of GDP per capita
Education > Expenditure per student, tertiary > % of GDP per capita
Education > Gross intake rate in grade 1, female > % of relevant age group
Education > Gross intake rate in grade 1, total > % of relevant age group
Education > Literacy rate, adult female > % of females ages 15 and above
Education > Literacy rate, adult male > % of males ages 15 and above
Education > Literacy rate, adult total > % of people ages 15 and above
Education > Literacy rate, youth female > % of females ages 15-24
Education > Literacy rate, youth male > % of males ages 15-24
Education > Literacy rate, youth total > % of people ages 15-24
Education > Persistence to grade 5, female > % of cohort
Education > Persistence to grade 5, male > % of cohort
Education > Persistence to grade 5, total > % of cohort
Education > Primary completion rate, female > % of relevant age group
Education > Primary completion rate, male > % of relevant age group
Education > Primary completion rate, total > % of relevant age group
Education > Primary education, duration > years
Education > Primary education, pupils > % female
Education > Primary education, pupils (per capita)
Education > Primary education, teachers > % female
Education > Primary education, teachers (per capita)
Education > Progression to secondary school > %
Education > Progression to secondary school, female > %
Education > Progression to secondary school, male > %
Education > Public spending on education, total > % of GDP
Education > Public spending on education, total > % of government expenditure
Education > Pupil-teacher ratio, primary
Education > Ratio of female to male enrollments in tertiary education
Education > Ratio of female to male primary enrollment
Education > Ratio of female to male secondary enrollment
Education > Ratio of girls to boys in primary and secondary education > %
Education > Ratio of young literate females to males > % ages 15-24
Education > Repetition rate, primary, female > % of total enrollment
Education > Repetition rate, primary, male > % of total enrollment
Education > Repetition rate, primary > % of total enrollment
Education > School enrollment, preprimary, female > % gross
Education > School enrollment, preprimary > % gross
Education > School enrollment, preprimary, male > % gross
Education > School enrollment, primary, female > % gross
Education > School enrollment, primary, female > % net
Education > School enrollment, primary > % gross
Education > School enrollment, primary, male > % gross
Education > School enrollment, primary, male > % net
Education > School enrollment, primary > % net
Education > School enrollment, primary, private > % of total primary
Education > School enrollment, secondary, female > % gross
Education > School enrollment, secondary > % gross
Education > School enrollment, secondary, male > % gross
Education > School enrollment, secondary, private > % of total secondary
Education > School enrollment, tertiary, female > % gross
Education > School enrollment, tertiary > % gross
Education > School enrollment, tertiary, male > % gross
Education > Secondary education, general pupils (per capita)
Education > Secondary education, pupils > % female
Education > Secondary education, pupils (per capita)
Education > Secondary education, teachers > % female
Education > Secondary education, teachers (per capita)
Education > Secondary education, vocational pupils
Education > Secondary education, vocational pupils (per capita)
Education > Unemployment with primary education, female > % of female unemployment
Education > Unemployment with primary education, male > % of male unemployment
Education > Unemployment with primary education > % of total unemployment
Education > Unemployment with secondary education > % of total unemployment
Education > Universities > Top 100 (per capita)
Education > Universities > Top 500 (per capita)
Education > Universities > Top 200 (per capita)
Energy > Adjusted savings: energy depletion > % of GNI
Energy > Bitumen Asphalt > Exports (per capita)
Energy > Coal > Consumption by transportation industry (per capita)
Energy > Coal > Consumption in rail transport (per capita)
Energy > Combustible renewables and waste > metric tones of oil equivalent (per capita)
Energy > Electricity > Exports (per capita)
Energy > Electricity > Nuclear > Production (per capita)
Energy > Electricity > Nuclear > Production > Public (per capita)
Energy > Electricity > % of managers surveyed ranking this as a major business constraint
Energy > Electrical outages > days
Energy > Electric power consumption > kWh (per capita)
Energy > Electric power transmission and distribution losses > million kWh (per capita)
Energy > Electricity production from hydroelectric sources > kwh (per capita)
Energy > Electricity production from hydroelectric sources > % of total
Energy > Electricity production from natural gas sources > kwh (per capita)
Energy > Electricity production from natural gas sources > % of total
Energy > Electricity production from oil sources > kwh (per capita)
Energy > Electricity production from oil sources > % of total
Energy > Electricity production > kWh (per capita)
Energy > Gasworks Gas > Consumption by industry & construction (per capita)
Energy > Gasworks Gas > Net inland availability (per capita)
Energy > Gas-diesel oils > Bunkers (per capita)
Energy > imports > kt of oil equivalent (per capita)
Energy > imports, net > % of energy use
Energy > Investment in energy with private participation > current US$ (per capita)
Energy > Investment in energy with private participation > current US$ (per $ GDP)
Energy > Jet Fuel > Imports (per capita)
Energy > Lignite/Brown Coal > Changes in stocks at producers
Energy > Motor Gasoline > Imports (per capita)
Energy > Natural Gasoline > Gross inland availability (per capita)
Energy > Natural Gas (including LNG) > Re-injected (per capita)
Energy > Natural gas liquids n.e.s. > Exports (per capita)
Energy > Natural Gas Production > Billion cubic feet per day (per capita)
Energy > Natural Gas Production > Billion cubic metres (per capita)
Energy > Natural Gasoline > Production from plants (per capita)
Energy > Natural Gas Production > Million tonnes oil equivalent (per capita)
Energy > Natural Gasoline > Production (per capita)
Energy > Natural Gas Proved reserves > Trillion cubic metres (per capita)
Energy > Oil production in 1992 (per capita)
Energy > Oil Production > Million tonnes (per capita)
Energy > Oil Proved reserves > Thousand million barrels (per capita)
Energy > Oil Production > Thousand barrels daily (per capita)
Energy > Oil Refinery capacities > Thousand barrels daily (per capita)
Energy > Petroleum Coke > Exports (per capita)
Energy > production > kt of oil equivalent (per capita)
Energy > Residual Fuel Oil > Consumption in rail transport (per capita)
Energy > Uranium > Production (per capita)
Energy > use > kt of oil equivalent (per capita)
Environment > Adjusted savings: particulate emission damage > % of GNI
Environment > CO2 emissions > kg per 2000 PPP $ of GDP
Environment > CO2 emissions > kt (per capita)
Environment > CPIA policy and institutions for environmental sustainability rating
Environment > Forest area > % of land area
Environment > Forest area > sq. km
Environment > Forest area > sq. km (per capita)
Environment > Known breeding bird species (per capita)
Environment > PM10, country level > micrograms per cubic meter
Environment > Pollution > Carbon Dioxide from fossil fuels 2000 (per capita)
Environment > Water pollution, chemical industry > % of total BOD emissions
Environment > Water pollution, other industry > % of total BOD emissions
Environment > Water pollution, paper and pulp industry > % of total BOD emissions
Environment > Water pollution, wood industry > % of total BOD emissions
Food > beverages and tobacco > % of value added in manufacturing
Food > exports > % of merchandise exports
Food > imports > % of merchandise imports
Geography > Land area > sq. km (per capita)
Geography > Surface area > sq. km (per capita)
Government > CPIA equity of public resource use rating
Government > CPIA quality of public administration rating
Government > General government final consumption expenditure > constant 2000 US$ (per capita)
Government > General government final consumption expenditure > current US$ (per capita)
Government > General government final consumption expenditure > current US$ (per $ GDP)
Government > Management time dealing with officials > % of management time
Government > Policy uncertainty > % of managers surveyed ranking this as a major business constraint
Government > Proportion of seats held by women in national parliament > %
Government > Procedures to build a warehouse > number
Government > Procedures to build a warehouse > number (per capita)
Government > Procedures to enforce a contract > number
Government > Procedures to enforce a contract > number (per capita)
Government > Procedures to register property > number
Government > Procedures to register property > number (per capita)
Government > Start-up procedures to register a business > number
Government > Start-up procedures to register a business > number (per capita)
Government > Time required to build a warehouse > days
Government > Time required to enforce a contract > days
Government > Time required to register property > days
Government > Time required to start a business > days
Government > Time to prepare and pay taxes > hours
Government > Trademarks, nonresidents (per capita)
Government > Trademarks, residents (per capita)
Health > Adolescent fertility rate > births per 1,000 women ages 15-19
Health > Births attended by skilled health staff > % of total
Health > Birth rate, crude > per 1,000 people
Health > expenditure per capita > current US$
Health > expenditure, private > % of GDP
Health > expenditure, public > % of GDP
Health > expenditure, total > % of GDP
Health > External resources for health > % of total expenditure on health
Health > Female adults with HIV > % of population ages 15+ with HIV
Health > Fertility rate, total > births per woman
Health > Hospital beds > per 1,000 people
Health > Immunization, DPT > % of children ages 12-23 months
Health > Immunization, measles > % of children ages 12-23 months
Health > Improved sanitation facilities > % of population with access
Health > Improved sanitation facilities, rural > % of rural population with access
Health > Improved sanitation facilities, urban > % of urban population with access
Health > Improved water source > % of population with access
Health > Improved water source, rural > % of rural population with access
Health > Improved water source, urban > % of urban population with access
Health > Incidence of tuberculosis > per 100,000 people
Health > Investment in water and sanitation with private participation > current US$ (per capita)
Health > Investment in water and sanitation with private participation > current US$ (per $ GDP)
Health > Life expectancy at birth, female > years
Health > Life expectancy at birth, male > years
Health > Life expectancy at birth, total > years
Health > Out-of-pocket health expenditure > % of private expenditure on health
Health > Plastic surgery procedures (per capita)
Health > Prevalence of HIV, total > % of population ages 15-49
Health > Prevalence of undernourishment > % of population
Health > Tuberculosis cases detected under DOTS > %
Health > Tuberculosis treatment success rate > % of registered cases
Immigration > International migration stock > % of population
Immigration > Net migration
Immigration > Net migration (per capita)
Immigration > Refugees > Outflow (per capita)
Immigration > Refugee population by country or territory of asylum
Immigration > Refugee population by country or territory of asylum (per capita)
Immigration > Refugee population by country or territory of origin
Immigration > Refugee population by country or territory of origin (per capita)
Industry > Changes in inventories > current US$ (per capita)
Industry > Electrolux CO2 emissions (per capita)
Industry > Manufactures imports > % of merchandise imports
Industry > Manufacturing, value added > constant 2000 US$ (per capita)
Industry > Manufacturing, value added > current US$ (per capita)
Industry > Manufacturing, value added > current US$ (per $ GDP)
Industry > Patent applications, nonresidents (per capita)
Industry > Patent applications, residents (per capita)
Industry > value added > constant 2000 US$ (per capita)
Industry > value added > current US$ (per capita)
Industry > value added > current US$ (per $ GDP)
Internet > Broadband access
Internet > Broadband access (per capita)
Internet > Broadband subscribers
Internet > Broadband subscribers (per capita)
Internet > International Internet bandwidth > Mbps (per capita)
Internet > International Internet bandwidth > Mbps (per $ GDP)
Internet > Price basket for Internet > US$ per month
Internet > Secure Internet servers
Internet > Secure Internet servers (per capita)
Labor > Compensation of employees > % of expense
Labor > CPIA building human resources rating
Labor > Economically active children, female
Labor > Economically active children, male
Labor > Economically active children, study and work
Labor > Economically active children, study and work, female
Labor > Economically active children, study and work, male
Labor > Economically active children, total
Labor > Employment in industry > % of total employment
Labor > Employment in services > % of total employment
Labor > Firing cost > weeks of wages
Labor > force, female > % of total labor force
Labor > force participation rate, female > % of female population ages 15-64
Labor > force participation rate, male > % of male population ages 15-64
Labor > force participation rate, total > % of total population ages 15-64
Labor > force, total (per capita)
Labor > Labor force > By occupation > Industry
Labor > Labor force > By occupation > Services
Labor > Rigidity of employment index
Labor > Share of women employed in the nonagricultural sector > % of total nonagricultural employment
Labor > skills > % of managers surveyed ranking this as a major business constraint
Labor > Technicians in R&D > per million people
Labor > Unemployment, female > % of female labor force
Labor > Unemployment, male > % of male labor force
Labor > Unemployment, total > % of total labor force
Labor > Unemployment with secondary education, female > % of female unemployment
Labor > Unemployment with secondary education, male > % of male unemployment
Labor > Unemployment, youth female > % of female labor force ages 15-24
Labor > Unemployment, youth male > % of male labor force ages 15-24
Labor > Unemployment, youth total > % of total labor force ages 15-24
Labor > Workers' remittances and compensation of employees, paid > US$ (per capita)
Labor > Workers' remittances and compensation of employees, paid > US$ (per $ GDP)
Labor > Workers' remittances and compensation of employees, received > US$ (per capita)
Labor > Workers' remittances and compensation of employees, received > US$ (per $ GDP)
Labor > Workers' remittances, receipts > BoP, current US$ (per capita)
Media > Daily newspapers > per 1,000 people
Media > Fixed line and mobile phone subscribers > per 1,000 people
Media > Households with television > %
Media > Information and communication technology expenditure > current US$
Media > Information and communication technology expenditure > current US$ (per capita)
Media > Information and communication technology expenditure > current US$ (per $ GDP)
Media > International voice traffic > out and in, minutes (per capita)
Media > Investment in telecoms with private participation > current US$ (per capita)
Media > Investment in telecoms with private participation > current US$ (per $ GDP)
Media > Mobile phone subscribers (per capita)
Media > Personal computers (per capita)
Media > Price basket for mobile > US$ per month
Media > Price basket for residential fixed line > US$ per month
Media > Telephone average cost of call to US > US$ per three minutes
Media > Telephone average cost of call to US > US$ per three minutes (per capita)
Media > Telephone average cost of call to US > US$ per three minutes (per $ GDP)
Media > Telephone employees, total (per capita)
Media > Telephone mainlines (per capita)
Media > Telecommunications revenue > % GDP
Media > Telephone subscribers per employee
Media > Telephone subscribers (per capita)
Military > Arms exports > constant 1990 US$
Military > Arms exports > constant 1990 US$ (per capita)
Military > Arms imports > constant 1990 US$ (per capita)
Military > expenditure > % of GDP
Military > personnel > % of total labor force
Military > personnel (per capita)
Military > Tanks (per capita)
People > Age dependency ratio > dependents to working-age population
People > CPIA social protection rating
People > Population ages 0-14 > % of total
People > Population ages 15-64 > % of total
People > Population ages 65 and above > % of total
People > Population, female > % of total
People > Population growth > annual %
People > Population in largest city (per capita)
People > Population in the largest city > % of urban population
People > Population in urban agglomerations > more than 1 million (per capita)
People > Rural population growth > annual %
People > Urban population growth > annual %
People > Urban population (per capita)
Sports > 1980 Summer Paralympics > Silver
Sports > 2005 World Rhythmic Gymnastics Championships > Team All-Around > Ball
Sports > 2005 World Rhythmic Gymnastics Championships > Team All-Around > Clubs
Sports > 2005 World Rhythmic Gymnastics Championships > Team All-Around > Ribbon
Sports > 2005 World Rhythmic Gymnastics Championships > Team All-Around > Rope
Sports > 2005 World Rhythmic Gymnastics Championships > Team All-Around > Total
Sports > FIFA World Ranking > Men (per capita)
Sports > Olympic medals > Bronze > Sydney 2000 (per capita)
Sports > Olympic medals > Total > Sydney 2000 (per capita)
Sports > Olympic point totals > Sydney 2000 (per capita)
Taxation > CPIA fiscal policy rating
Taxation > Customs and other import duties > % of tax revenue
Taxation > Highest marginal tax rate, corporate rate > %
Taxation > Highest marginal tax rate, individual > on income exceeding, US$
Taxation > Highest marginal tax rate, individual rate > %
Taxation > Net taxes on products > current US$ (per capita)
Taxation > Net taxes on products > current US$ (per $ GDP)
Taxation > Other taxes > % of revenue
Taxation > Social contributions > % of revenue
Taxation > Tax Freedom Day > % Burden
Taxation > Tax Freedom Day > Day of Year
Taxation > Taxes on exports > % of tax revenue
Taxation > Taxes on goods and services > % of revenue
Taxation > Taxes on goods and services > % value added of industry and services
Taxation > Taxes on income, profits and capital gains > % of total taxes
Taxation > Taxes on international trade > % of revenue
Taxation > Tax payments > number
Taxation > Tax payments > number (per capita)
Taxation > Tax revenue > % of GDP
Taxation > Total tax rate > % of profit
Terrorism > Victims of the September 11th 2001 attacks (per capita)
Transportation > Air transport, passengers carried (per capita)
Transportation > Air transport, registered carrier departures worldwide (per capita)
Transportation > Airports > With unpaved runways > 1524 to 2437 m (per capita)
Transportation > Airports > With unpaved runways > 2438 to 3047 m
Transportation > Airports > With unpaved runways > 2438 to 3047 m (per capita)
Transportation > Airports > With unpaved runways > Over 3047 m (per capita)
Transportation > Container port traffic
Transportation > Railways, goods transported > million ton-km (per capita)
Transportation > Roads, goods transported > million ton-km
Transportation > Roads, goods transported > million ton-km (per capita)
Transportation > Roads, paved > % of total roads
Transportation > Travel services > % of commercial service exports
Transportation > Travel services > % of commercial service imports
2nd last
Agriculture > Area > Barley (per capita)
Agriculture > Area > Corn (per capita)
Agriculture > Area > Sunflowerseed (per capita)
Agriculture > Grains > Coarse grain production (per capita)
Agriculture > Grains > Rice exports (per capita)
Agriculture > Production > Sunflowerseed (per capita)
Agriculture > Production > Total Coarse Grain (per capita)
Crime > Courts > % of managers surveyed ranking this as a major business constraint
Crime > Police (per capita)
Crime > Total crimes (per capita)
Disasters > Tsunami aid recipients (per capita)
Disasters > Tsunami aid recipients (per $ GDP)
Disasters > Tsunami > Funds pledged (per capita)
Economy > Distribution of family income > Gini index
Economy > Exports > Canadian pulp, paper and paperboard exports > 2003
Economy > GDP per capita in 1820
Economy > Household final consumption expenditure > annual % growth
Economy > Money and quasi money (M2) as % of GDP
Economy > Patents granted (per capita)
Economy > Patents granted (per $ GDP)
Economy > Research and development personnel (per capita)
Education > Gross intake rate in grade 1, male > % of relevant age group
Education > Universities > Top 50 (per capita)
Energy > Coal > Changes in stocks at producers
Energy > Coke Oven Coke > Consumption by chemical industry (per capita)
Energy > Coke Oven Gas > Gross inland availability (per capita)
Energy > Coke Oven Gas > Production (per capita)
Energy > Crude Petroleum > Production from tar sands oil shales
Energy > Electricity > Hydro > Production > Self-producer (per capita)
Energy > Lignite-Brown Coal Briquettes > Production (per capita)
Energy > Lignite/Brown Coal > Consumption by energy sector (per capita)
Energy > Liquefied Petroleum Gas > Consumption by industry & construction (per capita)
Energy > Liquefied Petroleum Gas > Consumption by other industries and construction (per capita)
Energy > Naphtha > Conversion to other forms of energy (per capita)
Energy > Natural gas liquids n.e.s. > Exports
Energy > Natural Gasoline > Net transfers (per capita)
Energy > Natural Gasoline > Transfers out (per capita)
Energy > Nuclear Consumption > Million tonnes oil equivalent (per capita)
Energy > Nuclear energy consumption (per capita)
Energy > Nuclear reactors operable > MWe (per capita)
Energy > Nuclear reactors uranium required (per capita)
Energy > Oil production in 1972 (per capita)
Energy > Oil production in 1982 (per capita)
Energy > Residual Fuel Oil > Consumption by energy sector (per capita)
Energy > Vegetal Waste > Consumption by other consumers (per capita)
Environment > Known mammal species (per capita)
Health > Investment in water and sanitation with private participation > current US$
Health > Transplants > Kidney (per capita)
Health > Transplants > Total (per capita)
Industry > Electrolux Factories (per capita)
Media > Book production, titles by the Universal Decimal Classification > Generalities (per capita)
Media > Television > Digital TV households (per capita)
Military > Conventional arms exports (per capita)
Military > Navy personnel (per capita)
Religion > Catholic > Cardinals (per capita)
Religion > Catholic > Permanent Deacons (per capita)
Sports > FIFA World Ranking > Women (per capita)
Sports > Golf at the 2006 Asian Games > Men Team > +/- Par
Sports > Golf at the 2006 Asian Games > Men Team > Total
Sports > Summer olympic medals > All time (per capita)
Transportation > Airports > With paved runways > Over 3047 m (per capita)
Transportation > Airports > With unpaved runways > 1524 to 2437 m (per capita)
Transportation > Airports > With unpaved runways > Over 3047 m
3rd last
Agriculture > Area > Cotton (per capita)
Agriculture > Exports to USA > Chillies (per capita)
Agriculture > Exports to USA > Spinach (per capita)
Agriculture > Grains > Sorghum consumption (per capita)
Agriculture > Grains > Sorghum production (per capita)
Agriculture > Grains > Wheat consumption (per capita)
Agriculture > Grains > Wheat production (per capita)
Economy > Household final consumption expenditure per capita growth > annual %
Economy > IBRD loans and IDA credits > PPG DOD, current US$ (per $ GDP)
Economy > Net financial flows, IMF concessional > current US$ (per capita)
Economy > Net financial flows, IMF concessional > current US$ (per $ GDP)
Economy > Population under $2 a day (per capita)
Education > Proportion of primary education time spent learning social studies
Education > Universities > Top 50
Education > Universities > Top 500 (per $ GDP)
Education > Women to men parity index, as ratio of literacy rates, aged 15-24
Energy > Bitumen Asphalt > Exports
Energy > Coal > Changes in stocks at producers (per capita)
Energy > Coal > Consumption by transportation industry
Energy > Coal > Consumption in rail transport
Energy > Coal Proved Reserves > Anthracite and bituminous (per capita)
Energy > Electricity production from coal sources > kwh (per capita)
Energy > Gasworks Gas > Consumption by iron and steel industry (per capita)
Energy > Gas-diesel oils > Imports (per capita)
Energy > Lignite/Brown Coal > Conversion in briquetting plants (per capita)
Energy > Liquefied Petroleum Gas > Exports (per capita)
Energy > Naphtha > Imports (per capita)
Energy > Natural Gas Consumption > Billion cubic feet per day (per capita)
Energy > Natural Gas Consumption > Billion cubic metres (per capita)
Energy > Natural Gas Consumption > Million tonnes oil equivalent (per capita)
Energy > Natural Gas (including LNG) > Re-injected
Energy > Nuclear electricity generation (per capita)
Energy > Oil Consumption > Million tonnes (per capita)
Energy > Oil > Consumption (per capita)
Energy > Oil Consumption > Thousand barrels daily (per capita)
Energy > Oil imports > Net (per capita)
Energy > Petroleum Waxes > Imports (per capita)
Energy > Residual Fuel Oil > Bunkers (per capita)
Energy > Residual Fuel Oil > Consumption by other transportation (per capita)
Energy > Residual Fuel Oil > Consumption in road transport (per capita)
Geography > Largest city population (per capita)
Government > Time to resolve insolvency > years
Government > Trademarks, nonresidents
Health > Abortions (per capita)
Immigration > International migration stock, total
Industry > Electrolux hazardous waste generation (per capita)
Internet > ISP (per capita)
Labor > Child employment in agriculture, male > % of male economically active children ages 7-14
Labor > Child employment in services, female > % of female economically active children ages 7-14
Labor > Child employment in services > % of economically active children ages 7-14
Labor > regulations > % of managers surveyed ranking this as a major business constraint
Lifestyle > Roller coasters (per capita)
Media > Telephones > Mobile cellular (per capita)
Media > Television > Subscription TV revenues (per capita)
Sports > 1954 Asian Games > Medal tally > Silver
Sports > 1984 Summer Paralympics > Bronze
Sports > 2005-06 A1 Grand Prix of Nations, Malaysia > Main Race Results > Laps
Sports > Golf at the 2006 Asian Games > Men Team > Round 2 > Dec. 9
Sports > Golf at the 2006 Asian Games > Men Team > Round 4 > Dec. 11
Taxation > Tax rates > % of managers surveyed ranking this as a major business constraint
Terrorism > Victims of the September 11th 2001 attacks
Transportation > Airports (per capita)
Transportation > Airports > With unpaved runways > 914 to 1523 m (per capita)
Transportation > Airports > With unpaved runways > Under 914 m (per capita)
4th last
Agriculture > Arable land > hectares (per capita)
Agriculture > Cereal production (per capita)
Agriculture > Exports to USA > Garlic
Agriculture > Exports to USA > Garlic (per capita)
Agriculture > Exports to USA > Okra
Agriculture > Exports to USA > Red or adzuki beans
Agriculture > Exports to USA > Red or adzuki beans (per capita)
Agriculture > Exports to USA > Spinach
Agriculture > Exports to USA > Squash (per capita)
Agriculture > Production > Cotton (per capita)
Crime > Corruption > % of managers surveyed ranking this as a major business constraint
Disasters > Tsunami > Funds pledged (per $ GDP)
Disasters > Tsunami > Total aid package (per capita)
Economy > Budget > Revenues (per $ GDP)
Economy > GDP per capita in 1900
Economy > Patents granted
Economy > Population under $2 a day (per $ GDP)
Energy > Electricity > Consumption by chemical industry (per capita)
Energy > Electricity Generation > Terawatt-hours (per capita)
Energy > Electricity > Wind > Production > Self-producer (per capita)
Energy > Gasworks Gas > Consumption by iron and steel industry
Energy > Gas-diesel oils > Consumption by iron and steel industry (per capita)
Energy > Lignite-Brown Coal Briquettes > Consumption by households and other consumers (per capita)
Energy > Lignite-Brown Coal Briquettes > Consumption by households (per capita)
Energy > Lignite-Brown Coal Briquettes > Gross inland availability (per capita)
Energy > Lignite-Brown Coal Briquettes > Net inland availability (per capita)
Energy > Lignite/Brown Coal > Consumption by chemical industry (per capita)
Energy > Lignite/Brown Coal > Conversion in thermal power plants (per capita)
Energy > Lignite/Brown Coal > Statistical differences (per capita)
Energy > Naphtha > Consumption by other industries and construction (per capita)
Energy > Natural Gas (including LNG) > Consumption by households (per capita)
Energy > Natural Gas (including LNG) > Consumption in agriculture (per capita)
Energy > Nuclear reactors operable (per capita)
Energy > Oil reserves > Oil reserves > Highest estimate
Energy > Oil reserves > Oil reserves > Lowest estimate
Energy > Primary Energy Consumption > Million tonnes oil equivalent (per capita)
Energy > Residual Fuel Oil > Consumption by mining industry (energy commodities) (per capita)
Environment > Pollution > Carbon Dioxide from fossil fuels 2000 (per $ GDP)
Environment > Water pollution, clay and glass industry > % of total BOD emissions
Environment > Wetlands of intl importance > Area (per capita)
Health > Nutrition > Vitamin A supplementation coverage rate 6-59 months
Health > Smoking prevalence, females > % of adults
Industry > Motor vehicle production (per capita)
Industry > Other manufacturing > % of value added in manufacturing
Internet > Linux web servers (per capita)
Military > Conventional arms exports (per $ GDP)
People > Overseas Chinese > 2005 Population
Sports > 1966 British Empire and Commonwealth Games > Medals
Sports > 1970 British Commonwealth Games > Medals > Pos
Sports > 1972 Summer Paralympics > Total
Sports > 1982 Commonwealth Games > Medals table > Pos
Sports > 2005-06 A1 Grand Prix of Nations, Germany > Main Race Results > Laps
Sports > 2006-07 A1 Grand Prix of Nations, New Zealand > Total Points > Points
Sports > 36th Chess Olympiad > Overall title > Average placing
Sports > Golf at the 2006 Asian Games > Men Team > Round 1 > Dec. 8
Taxation > Average time to clear customs > days
Taxation > Taxes on income, profits and capital gains > % of revenue
Transportation > Airports > With paved runways > 1524 to 2437 m (per capita)
Transportation > Airports > With paved runways > 2438 to 3047 m (per capita)
Transportation > Airports > With paved runways > Under 914 m (per capita)
Transportation > Airports > With unpaved runways > 914 to 1523 m (per capita)
Transportation > Airports > With unpaved runways > Total (per capita)
Transportation > Pipelines > Liquid petroleum gas (per capita)
Transportation > Railways, passengers carried > million passenger-km (per capita)
5th last
Agriculture > Area > Total Coarse Grain (per capita)
Agriculture > Exports to USA > Okra (per capita)
Agriculture > Exports to USA > Plantains (per capita)
Agriculture > Exports to USA > Vegetables (per capita)
Agriculture > Grains > Wheat exports
Agriculture > Grains > Wheat imports
Agriculture > Production > Wheat (per capita)
Agriculture > Yield > Sorghum
Agriculture > Yield > Soybean
Agriculture > Yield > Total Coarse Grain
Crime > Burglaries (per capita)
Crime > Convicted (per capita)
Economy > Bank and trade-related lending > PPG + PNG > NFL, current US$ (per $ GDP)
Economy > Research and development spending (per capita)
Economy > Research and development spending (per $ GDP)
Education > Literacy rates, aged 15-24
Education > Literacy rates, aged 15-24 > Women
Education > Universities > Top 50 (per $ GDP)
Energy > Coke Oven Coke > Exports (per capita)
Energy > Coke Oven Coke > Production (per capita)
Energy > Jet Fuel > Changes in stocks
Energy > Jet Fuel > Gross inland availability (per capita)
Energy > Lignite/Brown Coal > Conversion to other forms of energy (per capita)
Energy > Lignite/Brown Coal > Production (per capita)
Energy > Naphtha > Consumption by other industries and construction
Energy > Naphtha > Net inland availability (per capita)
Energy > Natural Gas (including LNG) > Consumption by households and other consumers (per capita)
Energy > Natural Gas (including LNG) > Consumption by industry & construction (per capita)
Energy > Natural gas liquids n.e.s. > Gross inland availability (per capita)
Energy > Natural gas liquids n.e.s. > Production from plants (per capita)
Energy > Natural gas liquids n.e.s. > Production (per capita)
Energy > Other biomass and wastes > Consumption by other consumers (per capita)
Energy > Other Petroleum Products > Exports (per capita)
Energy > Petroleum Coke > Consumption for non-energy uses (per capita)
Energy > Petroleum Coke > Production from refineries (per capita)
Energy > Petroleum Coke > Total production (per capita)
Energy > Petroleum Waxes > Production from refineries (per capita)
Energy > Petroleum Waxes > Statistical differences (per capita)
Energy > Petroleum Waxes > Total production (per capita)
Energy > Residual Fuel Oil > Consumption in inland and coastal waterways (per capita)
Energy > Vegetal Waste > Consumption by other consumers
Health > SARS median age range
Industry > Manufactures exports > % of merchandise exports
Labor > Workers' remittances, receipts > BoP, current US$ (per $ GDP)
Lifestyle > Amateur radio operators
Media > Book production, titles by the Universal Decimal Classification > Philology (per capita)
Media > Book production, titles by the Universal Decimal Classification > Philosophy, psychology (per capita)
Media > Book production, titles by the Universal Decimal Classification > Pure sciences (per capita)
Media > Book production, titles by the Universal Decimal Classification > Social sciences (per capita)
Media > Telephones > Mobile cellular
Military > US military exports (per capita)
Religion > Catholic > Cardinals (per $ GDP)
Sports > 1972 Summer Paralympics > Gold
Sports > 1974 British Commonwealth Games > Medals > Pos
Sports > 1978 Commonwealth Games > Medals > Pos
Sports > 1980 Summer Paralympics > Gold
Sports > 2006-07 A1 Grand Prix of Nations, Malaysia > Feature Race Results > Time
Sports > 2006-07 A1 Grand Prix of Nations, Netherlands > Main Race Results > Laps
Sports > 2005-06 A1 Grand Prix of Nations, South Africa > Main Race Results > Laps
Sports > 36th Chess Olympiad > Overall title > Open division placing
Sports > 36th Chess Olympiad > Overall title > Women's division placing
Sports > Mt Everest ascents > Duration 1991-2001 (per capita)
Sports > Olympic point totals > Sydney 2000
Transportation > Airports > With unpaved runways > 2438 to 3047 m (per $ GDP)
6th last
Agriculture > Exports to USA > Berries
Agriculture > Exports to USA > Berries (per capita)
Agriculture > Exports to USA > Hazelnuts or filberts (per capita)
Agriculture > Exports to USA > Prunes (per capita)
Agriculture > Exports to USA > Walnuts (per capita)
Agriculture > Grains > Rice stocks (per capita)
Agriculture > Yield > Sunflowerseed
Crime > Frauds (per capita)
Disasters > Tsunami aid recipients
Disasters > Tsunami > Total aid package (per $ GDP)
Economy > Adjusted net savings, including particulate emission damage > % of GNI
Economy > Budget > Expenditures > Capital (per capita)
Economy > Budget > Expenditures (per $ GDP)
Economy > GDP per capita in 1973
Economy > Net financial flows, RDB nonconcessional > current US$ (per capita)
Economy > Population under $1 a day (per capita)
Economy > Quasi-liquid liabilities > % of GDP
Economy > Share of household income > Highest 10%
Economy > Trade with US > US exports of gas-natural
Economy > Trade with US > US exports of spacecraft, excluding military
Energy > Coal > Consumption by households (per capita)
Energy > Coal Proved Reserves > Sub-bituminous and Lignite (per capita)
Energy > Crude Petroleum > Changes in stocks at producers (per capita)
Energy > Fuelwood > Conversion in other energy-producing plants
Energy > Gasworks Gas > Net inland availability
Energy > Gas-diesel oils > Consumption by chemical industry (per capita)
Energy > Lignite/Brown Coal > Additional resources (per capita)
Energy > Liquefied Petroleum Gas > Production from plants (per capita)
Energy > Motor Gasoline > Net transfers
Energy > Motor Gasoline > Transfers in
Energy > Naphtha > Consumption by industry & construction (per capita)
Energy > Naphtha > Energy balance requirement
Energy > Natural Gas (including LNG) > Consumption by other industries and construction (per capita)
Energy > Natural Gas (including LNG) > Consumption for non-energy uses (per capita)
Energy > Natural Gas (including LNG) > Conversion to other forms of energy (per capita)
Energy > Natural Gas (including LNG) > Net inland availability (per capita)
Energy > Natural gas liquids n.e.s. > Statistical differences (per capita)
Energy > Oil refining ability (per capita)
Energy > Other biomass and wastes > Consumption by other consumers
Energy > Petroleum Coke > Energy balance requirement
Energy > Petroleum Waxes > Consumption for non-energy uses (per capita)
Energy > Petroleum Waxes > Gross inland availability (per capita)
Energy > Residual Fuel Oil > Consumption in rail transport
Energy > Residual Fuel Oil > Consumption in road transport
Energy > Uranium > Estimated additional reserves (per capita)
Energy > Uranium > Production
Energy > Vegetal Waste > Consumption by households (per capita)
Environment > Snow Leopard > Estimated Population
Environment > Snow Leopard > Habitat, population, and home range > Habitat Area in sq. km.
Environment > Water pollution, textile industry > % of total BOD emissions
Food > Subway resturants (per capita)
Health > Pregnant women receiving prenatal care > %
Immigration > Refugees and internally displaced persons > IDPs (per capita)
Immigration > to Sweden
Labor > Child employment in agriculture > % of economically active children ages 7-14
Labor > Child employment in services, male > % of male economically active children ages 7-14
Labor > Workers' remittances and compensation of employees, paid > US$
Media > Book production, titles by the Universal Decimal Classification > Applied sciences (per capita)
Media > Book production, titles by the Universal Decimal Classification > Geography, history (per capita)
Military > Iraq pledges of reconstruction aid (per capita)
Military > Military Capabilities > Defense Budget
Military > Military Capabilities > Tanks
Military > military expenditures > Stockholm International Peace Research Institute Figures > Military expenditures, USD
People > Population in largest city
Religion > Jews (per capita)
Sports > 1954 Asian Games > Medal tally > Gold
Sports > 1958 British Empire and Commonwealth Games > Medals
Sports > 1958 British Empire and Commonwealth Games > Medals > Pos
Sports > 1980 Summer Paralympics > Total
Sports > 1984 Summer Paralympics > Silver
Sports > 1984 Summer Paralympics > Total
Sports > 1996 Summer Olympics medals per capita > Total
Sports > 2006-07 A1 Grand Prix of Nations, Australia > Feature Race Results > Laps
Sports > Beach Volleyball at the 2006 Lusophony Games > Pos
Sports > Golf at the 2006 Asian Games > Men Team > Round 3 > Dec. 10
Related links:
Save this page on
del.icio.us
/
furl
/
your bookmarks
More facts and figures on
India
Agriculture
(233)
Background
(4)
Crime
(39)
Currency
(10)
Disasters
(14)
Democracy
(29)
Economy
(1366)
Education
(169)
Environment
(79)
Energy
(601)
Food
(5)
Geography
(49)
Government
(100)
Health
(141)
Internet
(23)
Immigration
(25)
Industry
(48)
Identification
(19)
Labor
(114)
Language
(11)
Lifestyle
(10)
Media
(130)
Military
(89)
Mortality
(5)
People
(232)
Religion
(44)
Sports
(201)
Taxation
(36)
Terrorism
(27)
Transportation
(139)
COMMENTARY
Post Reply
There are
1
more (non-authoritative) comments
on this page
Share your thoughts, questions and commentary here
Your name
Your comments
Please enter the 5-letter protection code
Want to know more?
Search encyclopedia, statistics and forums:
Lesson Plans
|
Student Area
|
Student FAQ
|
Reviews
|
Press Releases
|
Feeds
|
Contact
©
Copyright
NationMaster.com 2003-2009. All Rights Reserved. Usage implies agreement with
terms
.